

Data Science Tools and Libraries: A Beginner's Toolkit
The data science tools and Python libraries worth learning first: NumPy, pandas, matplotlib, scikit-learn, SQL, Jupyter and Git, and in what order.
Walk into any tailor's shop near Rajwada and look at the counter. You will see a measuring tape, chalk, two pairs of scissors, a sewing machine and a box of threads. A beginner tailor does not buy a computerised embroidery machine on day one. They master the tape, scissors and machine first, because every garment needs them.
Data science works the same way. Lists of "50 tools every data scientist must know" make beginners panic. In practice, a handful of tools do most of the daily work, and the rest are specialised machines you pick up when a job demands them.
What are data science tools?
Mapping the tailor's counter:
- The measuring tape and chalk are SQL and pandas: they measure and mark the raw material.
- The scissors are NumPy: they cut numbers quickly and precisely.
- The sewing machine is scikit-learn: it turns prepared pieces into a finished model.
- The mirror where the customer checks the fit is matplotlib and seaborn: charts that show whether the result looks right.
Data science tools are the programming languages, libraries and applications used to collect, clean, explore, model and share data, with Python and its open-source libraries forming the core for most beginners.
The libraries are stacked: pandas is built on NumPy, seaborn is built on matplotlib, and scikit-learn expects NumPy arrays or pandas tables. That is why the learning order matters.
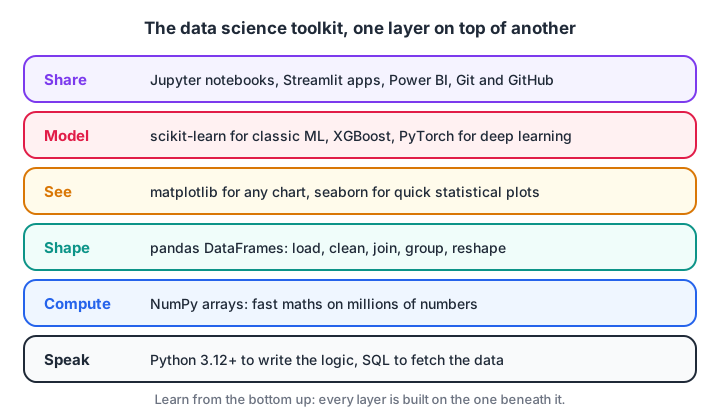
Each layer depends on the one beneath it, so learning bottom up saves you confusion later.
Programming languages for data science
Python
Python is a general-purpose programming language and the default language of data science today. It reads almost like English, has a huge set of free libraries, and the same code can go from a notebook to a web service. If you are new to it, start with getting started with Python.
SQL
SQL is the language for asking questions of databases. Company data lives in databases, so you will usually write a SQL query before any Python. Interviewers test it early.
R and others
R is a language designed for statistics, still common in research, pharma and some analytics teams. You can learn it later if a job needs it. Julia and Scala appear in niche roles but are not needed for a first job.
Core Python libraries for data science
These five libraries cover most beginner and junior work. All are free and open source.
| Library | Category | What you use it for | Learn it |
|---|---|---|---|
| NumPy | Numerical computing | Fast arrays and maths on millions of numbers | First |
| pandas | Data manipulation | Loading, cleaning, joining and grouping tables | Second |
| matplotlib | Plotting | Any chart, fully customisable | Third |
| seaborn | Statistical plotting | Quick, good-looking statistical charts from DataFrames | Third |
| scikit-learn | Machine learning | Classic models, preprocessing, evaluation | Fourth |
Here is how the first and last layers cooperate on a tiny task. NumPy creates the numbers, pandas organises them, and scikit-learn learns from them, all in one short script.
import numpy as np
import pandas as pd
from sklearn.linear_model import LinearRegression

# NumPy: generate 30 days of temperature and cold drink sales
rng = np.random.default_rng(1)
temp = rng.uniform(24, 42, 30).round(1)
sales = (12 * temp - 180 + rng.normal(0, 15, 30)).round()

# pandas: put them in a table and summarise
df = pd.DataFrame({"temp_c": temp, "bottles": sales})
print(df.describe().loc[["mean", "min", "max"]].round(1))

# scikit-learn: learn the relationship and predict
model = LinearRegression().fit(df[["temp_c"]], df["bottles"])
print(f"Each extra degree adds about {model.coef_[0]:.1f} bottles")
print("Forecast at 40 C:", round(model.predict(pd.DataFrame({"temp_c": [40]}))[0]))
Each library has its own tutorial in this series: NumPy arrays explained, the pandas DataFrame tutorial, data visualization with matplotlib and the seaborn tutorial.
Machine learning and deep learning libraries
After scikit-learn, two groups matter:
- Gradient boosting libraries such as XGBoost and LightGBM. They often win on tabular data like sales or loan records.
- Deep learning frameworks, mainly PyTorch, plus TensorFlow with Keras. You need these for images, audio and text models.
Leave deep learning until you can train and evaluate a scikit-learn model confidently. The concepts transfer, and debugging is far easier on simple models first.
Quick check
You need a quick statistical chart straight from a DataFrame with colour by category. Which tool fits best?
seaborn is built for statistical plots from DataFrames and handles colour grouping with the hue argument.
Notebooks, editors and version control
Jupyter and VS Code
A Jupyter notebook mixes code, output, charts and notes in one document, which makes it ideal for exploration. VS Code is a free code editor that can open notebooks too, and it is better for turning a notebook into clean .py files. Google Colab gives you a hosted notebook in the browser when your laptop is slow.
Git and GitHub
Git records every change to your code so you can undo mistakes and work with others. GitHub hosts your repositories online, and for a fresher it doubles as a portfolio that recruiters open. Learn the five commands git init, add, commit, push and pull early.
# Set up a project and keep its environment separate
python -m venv .venv
source .venv/bin/activate          # Windows: .venv\Scripts\activate
pip install numpy pandas matplotlib seaborn scikit-learn jupyter
pip freeze > requirements.txt
git init && git add . && git commit -m "Start sales analysis project"
The first two lines create a virtual environment, an isolated folder of packages for one project. It stops one project's library versions from breaking another's.
Tools for each stage of a data science project
Another way to remember the toolkit is by the stage of work you are in. This follows the same order as the data science lifecycle.
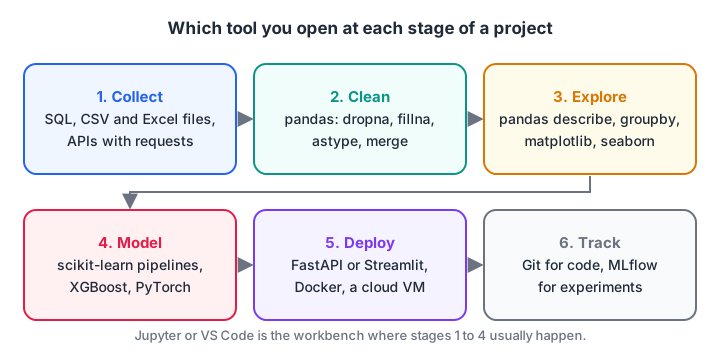
Most of your time as a beginner is spent in stages 1 to 3, which is why SQL and pandas matter so much.
Business intelligence tools
Power BI and Tableau build interactive dashboards without much code. They belong more to the analyst's kit, but data scientists often hand results to business teams through them.
Big data and cloud tools
When data no longer fits in one laptop's memory, teams use Apache Spark (often through PySpark), cloud data warehouses and cloud notebooks on AWS, Azure or Google Cloud. A fresher rarely needs these on day one; knowing what they are for is enough until a job requires them.
Deployment tools
To let others use a model, you wrap it in a small web API with FastAPI, or a quick interface with Streamlit, and often package it with Docker. That work leans towards the ML engineer role described in data scientist vs data analyst vs ML engineer.
How to learn data science tools in the right order
- Python basics until you can write loops, functions and dictionaries without help.
- NumPy for arrays and vectorised maths.
- pandas for real tables, together with SQL on the same questions.
- matplotlib and seaborn to see your data.
- scikit-learn for your first models.
- Git and GitHub from your first project onwards.
- Add XGBoost, PyTorch, Power BI, Spark or Docker only when a project or job description asks for it.
Learning this stack with a fixed weekly plan is easier with a teacher reviewing your code. The Debugshala data science curriculum follows this bottom-up order in its Indore classrooms and online batches. You can test your library knowledge any time with quick Python and pandas quizzes on Debugshala Test.
Quick check
Which library is pandas built on?
pandas stores its columns as NumPy arrays, which is why NumPy is the layer to learn first.
Common mistakes with data science tools
- Collecting tools instead of skills. Listing 25 tools on a resume invites questions you cannot answer. Five tools used well beat twenty used once.
- Skipping NumPy and pandas for deep learning. Every model needs clean input, and that work happens in pandas.
- No virtual environment. Installing everything globally leads to version clashes between projects.
- Keeping work only in notebooks. Move reusable code into
.pyfiles and commit it to Git.
Key takeaways
- Python and SQL are the two languages to learn first.
- NumPy, pandas, matplotlib, seaborn and scikit-learn cover most beginner work.
- Jupyter or VS Code is your workbench; Git and GitHub keep your work safe and visible.
- Deep learning, big data, BI and deployment tools come later, when a project needs them.
- Learn bottom up, because each library builds on the one below it.
FAQ
Which tool is most used in data science?
Python is the most used tool, together with its libraries pandas and NumPy. SQL comes a close second because company data sits in databases. Most data scientists open a Jupyter notebook or VS Code, query data with SQL, clean it with pandas and model it with scikit-learn.
Do I need to learn both Python and R?
No. For most beginners, Python alone is enough to get a first data science job, because it covers analysis, modelling and deployment. Learn R later only if your target role, such as academic research or some pharma analytics teams, asks for it.
Is Excel a data science tool?
Yes, for small data and quick checks. Many business teams still share data in Excel, so you should be comfortable with filters, pivot tables and lookups. For anything repeatable or larger than a few lakh rows, move the work to pandas or SQL.
Are data science tools free?
Most core tools are free and open source: Python, NumPy, pandas, matplotlib, seaborn, scikit-learn, Jupyter, VS Code and Git. Paid tools include some BI licences, cloud computing time and commercial platforms such as SAS, which some banks and pharma companies use.
Can I learn these data science tools in Indore with a mentor?
Yes. Debugshala's Data Science & AI course at Old Palasia, Indore, teaches Python, the core libraries, SQL and machine learning in English and Hindi, and the course is also available online. Non-IT graduates can join, and a free demo class lets you check the teaching style first.
From the team behind this site
Go further with the Data Science & AI Course at Debugshala
These tutorials are written by Debugshala, a training and placement institute at Old Palasia, Indore. The classroom course adds live mentoring, real projects and interview preparation.
- Offline classes at Old Palasia, Indore
- Free demo class before you pay
- Non-IT, fresher and year-gap friendly
- Placement assistance
700+ students placed · 200+ hiring partners · 4.9★ Google rating
