

Data Science Projects for Beginners: 8 Ideas with Steps
Eight data science projects for beginners using Indian public data, a four-level project ladder, step-by-step method and a runnable mini project.
Think of learning to cook. You can spend a month practising chopping onions, and you will chop beautifully. But the first time you make a full dal-chawal for your family, you learn things no chopping drill taught you: timing, tasting, what to do when the dal is too thin, and how to serve it.
Courses and exercises are the chopping drills of data science. A project is the full meal. It forces you to deal with messy data, choose what to measure, and explain the result to someone who did not watch you cook.
What makes a good data science project for beginners?
Mapping the kitchen:
- The dish you decide to cook is your question ("Did Diwali week change air quality in Indore?").
- The raw ingredients are your dataset, which usually arrives dirty.
- Cooking and tasting is cleaning, analysis and modelling.
- Serving the meal is your write-up: the answer, a chart and its limitations.
A data science project is a small, complete piece of work that starts with a specific question, uses real data to answer it, and communicates the answer with evidence and stated limitations.
Notice that a model is not part of the definition. Many strong beginner projects are pure analysis with a statistical test. If you want model-heavy ideas, see machine learning projects for beginners; this page focuses on analysis-led data science.
A good beginner project has four qualities:
- A question a non-technical person cares about. "Which Indore area has the cheapest 2BHK rent per square foot?" beats "Analysis of rental dataset".
- Data you can actually get. Public portals, a scraped page you are allowed to use, or your own records.
- A finish line. One question, answered. Not "explore everything".
- An honest ending. What the data cannot tell you.
The beginner project ladder
Build projects in order of difficulty. Each level adds one new skill and reuses everything below it.
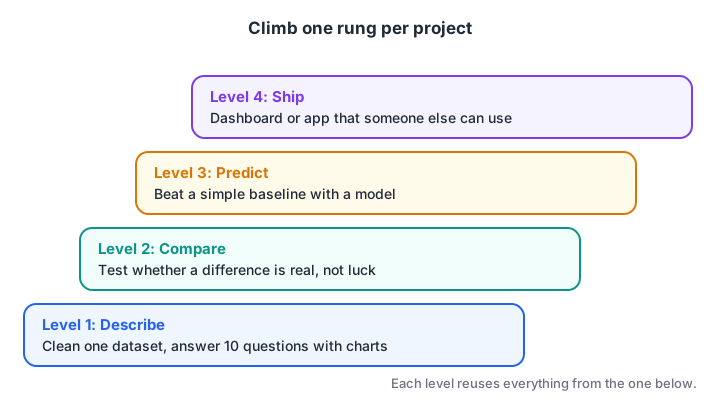
Level 1 needs pandas and charts, Level 2 adds a statistical test, Level 3 adds a model and Level 4 adds a user.
| Level | You prove you can | Tools | Typical output |
|---|---|---|---|
| 1. Describe | Clean data and summarise it | pandas, matplotlib or seaborn | Notebook with 8 to 10 answered questions |
| 2. Compare | Tell a real difference from luck | NumPy, SciPy or a permutation test | Finding with a p-value or confidence interval |
| 3. Predict | Beat a simple baseline | scikit-learn | Model with test-set metric and error analysis |
| 4. Ship | Make it usable by someone else | Streamlit, Power BI | Live dashboard or app with a README |
8 data science project ideas for beginners with Indian data
Each idea lists the question, where data typically comes from, and which ladder level it suits. India's Open Government Data Platform is a good first place to search for public datasets.
1. Air quality before, during and after Diwali (Level 1 to 2)
Question: how much does PM2.5 rise in your city during Diwali week compared with the weeks around it? Use daily pollutant readings published by pollution control boards. You practise date handling, rolling averages and a before-and-after comparison.
2. Soybean or onion mandi price patterns (Level 1 to 3)
Question: in which months are prices highest, and can last month's price forecast next month's? Mandi price records are available on government agriculture portals. Start with monthly averages; later try a simple forecast as in time series analysis.
3. Monsoon rainfall and crop yield (Level 2)
Question: do districts with more July rainfall produce more soybean per hectare? You practise joining two datasets by district and year, plus correlation, and you learn why correlation is not causation.
4. IPL batting analysis (Level 1 to 2)
Question: do teams batting first at a given ground win more often? Ball-by-ball cricket data is widely shared publicly. It is a fun dataset with clean structure, so it suits your very first project.
5. Indore rent per square foot by area (Level 1 to 3)
Question: which localities give the most space for the money? Collect 150 to 200 listings yourself into a spreadsheet, noting area, size, rent and furnishing. Collecting data yourself is a strong interview story.
6. Your own UPI spending analysis (Level 1)
Question: where does your money go each month, and which day of the week do you spend most? Export your own statement, remove personal details and categorise transactions. Never publish raw personal data; share only the aggregated results.
7. Train delay patterns (Level 2 to 3)
Question: are evening trains on a route more delayed than morning ones? Record running status for a few trains over several weeks, or find a public delay dataset. You practise grouping, box plots and a two-group comparison.
8. Voter turnout and literacy by district (Level 2)
Question: do districts with higher literacy have higher turnout? Election and census figures are published by official bodies. You practise merging, scatter plots and careful wording, because the topic needs neutral language.
Quick check
Which is the best question for a beginner data science project?
A good project question is specific, answerable with available data, and matters to someone.
How to do a data science project, step by step
- Write the question in one sentence and the decision it would help.
- Get the data and save the raw file untouched. Work on a copy.
- Clean it: fix types, handle missing values, remove duplicates. Note every change.
- Explore: summary statistics and three to five charts. See exploratory data analysis.
- Answer the question with a number, a chart and, from Level 2, a test.
- Write the limits: sample size, missing months, what you could not measure.
- Publish the notebook and a short README on GitHub.
These steps mirror the data science lifecycle, shrunk to project size.
A mini project you can run: does the weekend change delivery time?
Here is a complete Level 2 project in about 25 lines. A cloud kitchen wants to know if weekend deliveries are really slower, or if the difference is just luck. A permutation test answers this by shuffling the weekday and weekend labels many times and asking how often a random shuffle produces a gap as large as the real one.
import numpy as np
import pandas as pd

rng = np.random.default_rng(11)
df = pd.DataFrame({
    "minutes": np.concatenate([rng.normal(31, 6, 140), rng.normal(34, 7, 60)]).round(1),
    "day_type": ["weekday"] * 140 + ["weekend"] * 60,
})
print(df.groupby("day_type")["minutes"].agg(["count", "mean", "median"]).round(1))

observed = df.loc[df.day_type == "weekend", "minutes"].mean() - df.loc[df.day_type == "weekday", "minutes"].mean()

labels = df["day_type"].to_numpy()
mins = df["minutes"].to_numpy()
gaps = []
for _ in range(3000):
    shuffled = rng.permutation(labels)
    gaps.append(mins[shuffled == "weekend"].mean() - mins[shuffled == "weekday"].mean())
p_value = np.mean(np.abs(gaps) >= abs(observed))

print(f"\nWeekend is slower by {observed:.1f} minutes")
print(f"p-value from permutation test: {p_value:.4f}")
print("Likely a real difference" if p_value < 0.05 else "Could easily be luck")
A small p-value means random shuffles almost never create a gap that big, so the weekend delay is probably real. The theory is in hypothesis testing. Replace the simulated numbers with your own data and you have a portfolio project.
What the write-up should say
End every project with a short summary a manager could read in a minute:
Question:  Are weekend deliveries slower than weekday deliveries?
Answer:    Yes, by about 2.3 minutes on average (permutation test, p = 0.013).
Data:      200 orders from one kitchen over 6 weeks.
Limits:    One kitchen only; weather and order size not recorded.
Next step: Add order size and rain to see whether they explain the gap.
If you want your projects reviewed by mentors and presented in front of a batch, project-based data science training at Debugshala builds the portfolio as you learn, with placement assistance after.
Quick check
In the permutation test above, what does a p-value of 0.40 suggest?
A large p-value means random label shuffles often produce a gap as big as the one observed.
Common mistakes in beginner data science projects
- Picking a dataset before a question. You end up with fifty charts and no point.
- Copying a popular notebook. Interviewers recognise the famous datasets and ask what you did differently.
- Hiding the messy parts. Explaining how you handled missing months is more impressive than pretending there were none.
- Claiming causation from correlation. "Literacy causes turnout" is not something a scatter plot can show.
- No limitations section. It signals you do not understand your own result.
Key takeaways
- Start with a specific question, then find data for it.
- Climb the ladder: describe, compare, predict, ship.
- Indian public data on air quality, prices, rainfall, cricket and elections makes original projects easy.
- Use a statistical test, such as a permutation test, before claiming a difference is real.
- Finish with a short write-up: question, answer, data, limits, next step.
FAQ
What is a good first data science project?
A good first project is a Level 1 analysis of a clean, interesting dataset, such as IPL match results or your own anonymised monthly spending. Ask eight to ten specific questions, answer each with a number and a chart, and write a short summary. It teaches cleaning, grouping and plotting without overwhelming you.
How many projects do I need for a data science job?
Two or three complete, original projects usually serve a fresher better than many unfinished ones. Aim for different levels: one strong analysis, one with a statistical test and one with a model or dashboard. Each should have a clear README explaining the question, method, result and limits.
Where can I find datasets for data science projects in India?
The Open Government Data Platform at data.gov.in publishes datasets on agriculture, health, transport and more. Pollution control boards publish air quality readings, and election and census bodies publish official figures. You can also collect your own data, such as rental listings, which makes your project stand out.
Do data science projects need machine learning?
No. Many valuable projects are analysis with clear charts and a statistical test. Recruiters want to see that you can ask a good question and answer it honestly. Add a model only when prediction actually helps the question, and always compare it with a simple baseline.
Can I get help building data science projects in Indore?
Yes. Debugshala's Data Science & AI course at Old Palasia, Indore, and online includes project work with mentors, in English and Hindi, and offers placement assistance. Fresh graduates and non-IT students can join, and you can attend a free demo class first. Between projects, practise statistics and Python questions on Debugshala Test.
From the team behind this site
Go further with the Data Science & AI Course at Debugshala
These tutorials are written by Debugshala, a training and placement institute at Old Palasia, Indore. The classroom course adds live mentoring, real projects and interview preparation.
- Offline classes at Old Palasia, Indore
- Free demo class before you pay
- Non-IT, fresher and year-gap friendly
- Placement assistance
700+ students placed · 200+ hiring partners · 4.9★ Google rating
