

Data Scientist vs Data Analyst vs ML Engineer: Roles Compared
Data scientist vs data analyst vs ML engineer: what each role does daily, the skills and tools it needs, and how to choose the right one for you.
Picture a busy sweet shop in Chhappan Dukan during Diwali week. Three people keep it running, and each has a different job.
The first person sits with the billing register every night and tells the owner, "Kaju katli sold 40% more than last Diwali, but soan papdi fell." The second person studies two years of registers, the weather and festival dates, and says, "Next Saturday we will need about 90 kg of kaju katli; make 10 kg extra if it rains."
The third person sets up the kitchen so that this forecast reaches the halwai every morning automatically, the weighing scale is calibrated, and nothing breaks when the rush comes.
All three work with the same register. They answer different questions.
What is the difference between a data analyst, data scientist and ML engineer?
Map the shop back to a company:
- The person reading last night's register is the data analyst. The question is "what happened, and where?"
- The person forecasting next Saturday is the data scientist. The question is "what will happen, and why?"
- The person automating the forecast in the kitchen is the ML engineer. The question is "how do we run this every day without failure?"
A data analyst describes past data to guide decisions, a data scientist builds statistical and machine learning models to predict or explain outcomes, and an ML engineer deploys and maintains those models as production software.
The titles blur in small companies, where one person may do all three. In larger teams the work is split and passed along a chain.
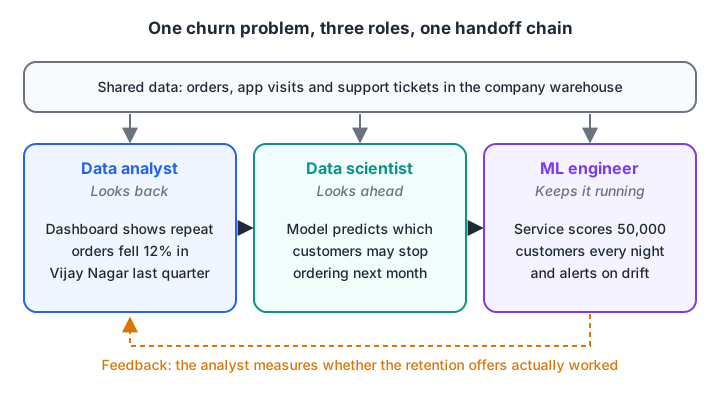
The analyst spots the drop, the scientist predicts who will leave, the engineer runs that prediction nightly, and the analyst then checks whether the response worked.
Quick check
Which task belongs most clearly to an ML engineer?
ML engineers turn models into dependable production software.
Data analyst vs data scientist vs ML engineer: side-by-side comparison
| Data analyst | Data scientist | ML engineer | |
|---|---|---|---|
| Main question | What happened? | What will happen, and why? | How do we run it reliably? |
| Typical output | Dashboards, reports, SQL queries | Models, experiments, forecasts | APIs, pipelines, monitoring |
| Core tools | SQL, Excel, Power BI or Tableau, pandas | Python, pandas, scikit-learn, statistics | Python, Docker, cloud, CI/CD, MLOps tools |
| Maths needed | Descriptive statistics | Probability, inference, ML theory | Enough ML to debug; strong software skills |
| Works most with | Business teams | Analysts and product managers | Software and platform engineers |
| Common entry path | Any graduate with SQL and Excel | Graduate with statistics and Python | Software engineer who learns ML |
The skill mix is the clearest way to see the difference. All three need SQL and clear communication; after that they lean in different directions.
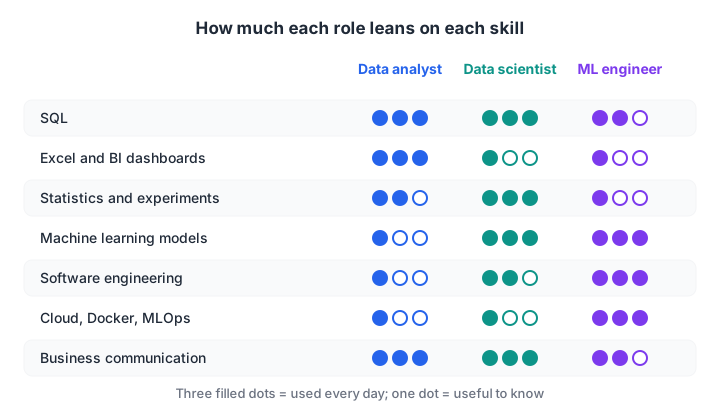
Analysts lean on BI tools, scientists on statistics and modelling, ML engineers on software and cloud.
What does each role do day to day?
The best way to feel the difference is to give all three the same small dataset of customer orders and see what each one writes.
The data analyst: summarise and explain
An analyst's first job is an accurate summary that a manager can act on. Here the analyst checks repeat orders by area.
import pandas as pd

orders = pd.DataFrame({
    "area": ["Vijay Nagar", "Palasia", "Rau"] * 4,
    "quarter": ["Q1"] * 6 + ["Q2"] * 6,
    "repeat_orders": [120, 95, 60, 104, 88, 57,    # Q1, two half-quarters
                      70, 92, 63, 50, 90, 55],     # Q2, two half-quarters
})
report = orders.pivot_table(index="area", columns="quarter",
                            values="repeat_orders", aggfunc="sum")
report["change_%"] = ((report["Q2"] - report["Q1"]) / report["Q1"] * 100).round(1)
print(report.sort_values("change_%"))
The output shows Vijay Nagar falling sharply while other areas are steady. That single finding, explained in a dashboard, is the analyst's value. Most of this work could also be done in SQL; see what a data analyst does for the full picture.
The data scientist: predict and test
The scientist asks a forward question: which customers are likely to stop ordering? That needs a model, a fair test set and an honest metric.
import numpy as np
from sklearn.linear_model import LogisticRegression
from sklearn.model_selection import train_test_split

rng = np.random.default_rng(7)
n = 400
days_since_last = rng.integers(1, 90, n)
orders_last_90 = rng.integers(0, 15, n)
# Customers who ordered long ago and rarely are more likely to churn
risk = 0.05 * days_since_last - 0.4 * orders_last_90 + rng.normal(0, 1, n)
churned = (risk > 1).astype(int)

X = np.column_stack([days_since_last, orders_last_90])
X_tr, X_te, y_tr, y_te = train_test_split(X, churned, test_size=0.25, random_state=0)
model = LogisticRegression().fit(X_tr, y_tr)

print("Baseline (always 'stays'):", round(1 - y_te.mean(), 3))
print("Model accuracy:           ", round(model.score(X_te, y_te), 3))
print("Churn chance, 60 days idle, 1 order:", round(model.predict_proba([[60, 1]])[0, 1], 2))
Notice the baseline line. A good data scientist always compares the model with a trivial guess, because a high accuracy can be meaningless when most customers stay. The model itself is explained in logistic regression.
The ML engineer: make it dependable
The engineer takes the scientist's model and wraps it so that bad inputs fail loudly, every prediction is fast, and the model can be saved and reloaded on a server.
import pickle, time
import numpy as np
from sklearn.linear_model import LogisticRegression

X = np.array([[5, 10], [80, 0], [40, 2], [10, 8], [70, 1], [15, 6]])
y = np.array([0, 1, 1, 0, 1, 0])
blob = pickle.dumps(LogisticRegression(C=0.05).fit(X, y))   # what gets shipped

model = pickle.loads(blob)                            # what the server loads
def score(days_since_last, orders_last_90):
    if not (0 <= days_since_last <= 365 and 0 <= orders_last_90 <= 500):
        raise ValueError("input out of expected range")
    return float(model.predict_proba([[days_since_last, orders_last_90]])[0, 1])

start = time.perf_counter()
results = [score(d, o) for d, o in [(3, 9), (65, 1), (30, 3)]]
ms = (time.perf_counter() - start) * 1000 / 3
print([round(r, 2) for r in results], f"avg {ms:.2f} ms per call")
try:
    score(-4, 2)
except ValueError as e:
    print("Rejected:", e)
In a real company this function would sit behind an API inside a Docker container, with logs and alerts. That world is covered in MLOps explained and ML model deployment.
Quick check
A manager asks why repeat orders dropped last quarter in one area. Which role usually answers first?
Explaining what already happened, by slicing past data, is the analyst's core job.
Which role should you choose?
There is no "best" role, only the best fit for what you enjoy. Use these steps:
- Check what you enjoy doing for hours. Explaining numbers to people points to analyst. Running experiments and reading about models points to scientist. Writing clean code and fixing systems points to ML engineer.
- Look at your current base. Commerce, BBA and non-IT graduates often start fastest as analysts. Maths, statistics and economics graduates suit data science. B.Tech CS graduates with coding strength suit ML engineering.
- Read ten real job descriptions for each title in your city. Note which tools repeat.
- Build one small project in the style of each role, like the three code blocks above, and see which one you want to extend. Pair it with role-wise SQL and Python quizzes on Debugshala Test to see where your basics are weak.
- Commit to one path for six months before switching. Depth gets you hired; scattered basics do not.
Can you move between these roles later?
Yes, and many people do. Analyst to data scientist is the most common move: you add statistics and modelling on top of SQL and business sense. Data scientist to ML engineer means adding software engineering, testing and cloud skills.
The data scientist roadmap shows the order of skills if you choose that path, and the data analyst roadmap does the same for analytics. The tools each role uses are listed in data science tools and libraries.
If you want guidance on choosing, Debugshala's Data Science & AI classes at Old Palasia cover analysis, modelling and deployment basics, so you get hands-on time with all three kinds of work before you specialise.
Common mistakes when comparing these roles
- Judging by job title alone. One company's "data scientist" builds dashboards; another's "analyst" trains models. Read the responsibilities.
- Thinking analyst is a lesser role. Good analysts drive many business decisions, and the skills are a strong base for data science later.
- Skipping software basics as a data scientist. Models that cannot leave a notebook rarely create value.
- Becoming an ML engineer without understanding the model. You cannot debug a drifting model you do not understand.
Key takeaways
- Analysts look back, scientists look ahead, ML engineers keep models running.
- All three need SQL, Python basics and clear communication.
- Analysts lean on BI tools, scientists on statistics and ML, ML engineers on software and cloud.
- Choose by what you enjoy and your current background, then go deep for six months.
- Moving from analyst to scientist to engineer is common and realistic.
FAQ
Is data analyst or data scientist better for a fresher?
Data analyst is usually the easier entry point for a fresher because it needs SQL, Excel and a BI tool rather than machine learning. Data scientist roles often expect stronger statistics and projects. Many people start as analysts and move to data science after a year or two of real work.
Does a data analyst need machine learning?
Not usually. Most analyst roles need SQL, spreadsheets, dashboards and descriptive statistics. Basic ML knowledge helps you talk with data scientists and can open a later move into data science, but it is rarely required for an analyst job.
Is ML engineering harder than data science?
It is different rather than harder. ML engineering needs stronger software engineering: testing, APIs, Docker and cloud. Data science needs stronger statistics and experiment design. A person who enjoys building systems may find ML engineering easier than a statistics-heavy data science role.
Can a non-IT graduate become a data scientist?
Yes. Non-IT graduates often start with analytics, learn Python and statistics, and then move into data science. Clear projects matter more than the degree name. Commerce and science graduates already have useful business or maths intuition.
Where can I learn data analysis and data science together in Indore?
Debugshala in Old Palasia, Indore, runs a Data Science & AI course in English and Hindi, offline and online, and separate Data Analytics and Machine Learning courses. Fresh graduates, non-IT students and people with a year gap can join, and a free demo class is available before you pay.
From the team behind this site
Go further with the Data Science & AI Course at Debugshala
These tutorials are written by Debugshala, a training and placement institute at Old Palasia, Indore. The classroom course adds live mentoring, real projects and interview preparation.
- Offline classes at Old Palasia, Indore
- Free demo class before you pay
- Non-IT, fresher and year-gap friendly
- Placement assistance
700+ students placed · 200+ hiring partners · 4.9★ Google rating
