

Data Science Lifecycle: 8 Stages Explained with an Example
The data science lifecycle from problem to monitoring, explained through a gym churn project with a diagram and Python code for every stage.
Think about how a family plans a wedding in Indore. Nobody starts by booking the band. First you agree on what kind of wedding you want and what the budget is.
Then you collect guest lists from both sides, remove duplicates (the same uncle appears on three lists), and look at the numbers to see how big the hall must be.
Only then do you book vendors, check things on the day, and note what to change next time.
A data science project follows almost the same order, and skipping a step causes the same kind of chaos. (If the term itself is new, read what data science is first.)
The data science lifecycle at a glance
Mapping the wedding onto data work:
- Agreeing on the type of wedding is defining the problem.
- Gathering guest lists is data collection.
- Removing the duplicate uncle is data cleaning.
- Counting guests per side and per city is exploratory data analysis (EDA).
- Booking vendors to match is modelling, and the trial run is evaluation.
- The actual day is deployment, and the review afterwards is monitoring.
The data science lifecycle is the repeatable sequence of stages that takes a project from a vague business question to a working solution that is checked over time.
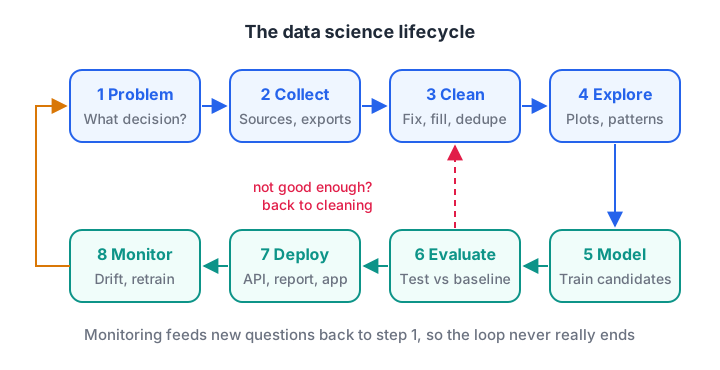
The lifecycle is a loop, not a straight line: evaluation can send you back to cleaning, and monitoring starts the next round.
Throughout this article we will follow one project. A gym in Vijay Nagar loses members every month and wants to call the ones likely to leave before their membership runs out.
Before modelling: problem, data and cleaning
Stage 1: Define the problem
Write the problem as a decision, a measure and a deadline. "Use AI on our member data" is not a problem. This is:
Every Monday, give the front desk a list of up to 10 members most likely to not renew, so they can call them. Success means more renewals among called members than among similar members who were not called.
A good problem statement also fixes what "churn" means. Here, a member has churned if they do not renew within 15 days after expiry. Without that line, two people on the team will label the same member differently.
Stage 2: Collect the data
List what you already have and where it lives. For the gym, that is the membership software (join date, plan, age), the door entry system (visits per week) and payment records.
Also ask what you are allowed to use: personal data such as phone numbers and health notes needs consent. In real projects you pull data with SQL or an export. Here we build a small table inline; if DataFrames are new to you, the pandas DataFrame tutorial explains every method used below.
import pandas as pd

members = pd.DataFrame({
    "member_id": [101, 102, 103, 104, 105, 106, 106, 107],
    "age": [24, 31, None, 45, 29, 38, 38, 22],
    "visits_per_week": [4, 1, 0, 3, 0, 2, 2, 5],
    "plan": ["monthly", "yearly", "monthly", "yearly", "monthly", "monthly", "monthly", "Monthly"],
    "renewed": [1, 0, 0, 1, 0, 1, 1, 1],
})
print(members)
print("Rows:", len(members))
Stage 3: Clean the data
Look closely and the problems show up: member 106 appears twice, one age is missing, and "Monthly" with a capital M will be treated as a different plan. Cleaning fixes each issue explicitly, and you write down what you changed.
import pandas as pd

members = pd.DataFrame({
    "member_id": [101, 102, 103, 104, 105, 106, 106, 107],
    "age": [24, 31, None, 45, 29, 38, 38, 22],
    "visits_per_week": [4, 1, 0, 3, 0, 2, 2, 5],
    "plan": ["monthly", "yearly", "monthly", "yearly", "monthly", "monthly", "monthly", "Monthly"],
    "renewed": [1, 0, 0, 1, 0, 1, 1, 1],
})

clean = members.drop_duplicates(subset="member_id").copy()
clean["plan"] = clean["plan"].str.lower()
clean["age"] = clean["age"].fillna(clean["age"].median())

print("Rows before:", len(members), "after:", len(clean))
print(clean["plan"].value_counts())
print(clean)Stage 4: Exploratory data analysis (EDA)
EDA means asking simple questions before you build anything. Do people who renew behave differently? If you are new to the summary numbers used here, read statistics for data science first.
import pandas as pd

clean = pd.DataFrame({
    "age": [24, 31, 31, 45, 29, 38, 22],
    "visits_per_week": [4, 1, 0, 3, 0, 2, 5],
    "plan": ["monthly", "yearly", "monthly", "yearly", "monthly", "monthly", "monthly"],
    "renewed": [1, 0, 0, 1, 0, 1, 1],
})

print(clean.groupby("renewed")["visits_per_week"].mean())
print()
print(clean.groupby("plan")["renewed"].mean().round(2))
The pattern jumps out: members who renewed visited about 3.5 times a week, while those who left visited about 0.3 times. That single insight is already useful. Even without a model, the front desk could call anyone who has stopped coming.
Quick check
In the gym example, which stage did we fix "Monthly" vs "monthly"?
Making categories consistent is a cleaning step. It has to happen before EDA, or the counts would be split across two labels.
Modelling, evaluation and deployment
Stage 5 and 6: Build a model and evaluate it
Now we build a model and, just as important, a baseline. A baseline is the dumbest reasonable approach. If your model cannot beat it, the model is not worth deploying.
Real projects use hundreds of members, so below we create a synthetic set of 300 with a fixed random seed, giving the same numbers on every run.
import numpy as np
from sklearn.linear_model import LogisticRegression
from sklearn.model_selection import train_test_split
from sklearn.metrics import accuracy_score

rng = np.random.default_rng(7)
visits = rng.integers(0, 6, 300)
age = rng.integers(18, 60, 300)
renew_chance = 0.15 + 0.15 * visits
renewed = (rng.random(300) < renew_chance).astype(int)
X = np.column_stack([visits, age])

X_tr, X_te, y_tr, y_te = train_test_split(X, renewed, test_size=0.3, random_state=0)

baseline = np.full(len(y_te), np.bincount(y_tr).argmax())
model = LogisticRegression().fit(X_tr, y_tr)

print("Baseline accuracy (always guess majority):", round(accuracy_score(y_te, baseline), 2))
print("Model accuracy:", round(accuracy_score(y_te, model.predict(X_te)), 2))
The test set is data the model never saw during training. Scoring on training data would be like a student grading their own exam. Accuracy is only one metric; for a call list you may care more about how many of the 10 called members were truly at risk.
Stage 7: Deploy the result
Deployment means putting the result where the decision happens. For the gym, that is not a web app. It is a Monday morning list in the front desk's WhatsApp group or spreadsheet.
import pandas as pd

def weekly_call_list(df, top_n=3):
    """Rank active members by risk: fewer visits = higher risk."""
    risk = 1 - (df["visits_per_week"].clip(upper=5) / 5)
    out = df.assign(risk=risk.round(2)).sort_values("risk", ascending=False)
    return out.head(top_n)[["member_id", "visits_per_week", "risk"]]

this_week = pd.DataFrame({
    "member_id": [201, 202, 203, 204, 205],
    "visits_per_week": [0, 4, 1, 5, 2],
})
print(weekly_call_list(this_week))
A simple rule that staff trust often beats a complex model nobody understands. You can swap in the trained model later without changing how the list is delivered.
Quick check
Why do we compare the model with a baseline?
A baseline tells you the score you would get for free. A model only earns its place if it clearly beats that.
Stage 8: Monitoring and repeating the loop
After deployment, the world keeps moving. A new gym opens nearby, the gym changes its pricing, or the door scanner breaks and records zero visits for everyone. This shift in the incoming data is called data drift, and it quietly breaks models.
Monitoring means checking a few numbers every week: the average visits in new data, the share of missing values, and whether called members actually renewed more. When those numbers move, you go back to stage 1 or 3. That is why the diagram is a loop.
Common mistakes across the lifecycle
- Vague problem statements. If you cannot say what decision changes, stop and ask before collecting data.
- No baseline. "85% accuracy" means nothing if guessing the majority class gives 83%.
- Testing on training data. It hides overfitting and gives false confidence.
- Forgetting monitoring. Models decay. Put a weekly check on the calendar from day one.
If you would like to practise this full loop alongside other learners, a structured classroom programme in Indore such as Debugshala's Data Science & AI course gives you a fixed schedule and classmates working through the same stages.
Key takeaways
- The lifecycle runs: problem, collection, cleaning, EDA, modelling, evaluation, deployment, monitoring.
- Write the problem as a decision with a measurable target before touching data.
- Clean in a fixed order and record each change.
- Always evaluate on unseen data and against a baseline.
- Deploy where the decision is made, then monitor for drift and loop back.
FAQ
Which stage of the data science lifecycle takes the most time?
Data collection and cleaning usually take the largest share of a project, often more than modelling and evaluation combined. Real data has duplicates, missing values and inconsistent labels, and each needs a deliberate fix. Good EDA also takes time because it shapes every later decision.
Is the data science lifecycle the same as CRISP-DM?
CRISP-DM is a well-known published version of the same idea, with six phases from business understanding to deployment. The eight stages here split some of those phases further and make monitoring explicit. The names differ between companies, but the order and the loop are the same.
Do I need machine learning in every data science project?
No. In the gym example, the EDA alone showed that low visits predict churn, and a simple rule was enough to start. Use a model when it clearly beats the simple approach and the extra complexity is worth maintaining.
Where can I practise end-to-end data science projects in Indore?
Debugshala runs a Data Science & AI course at its Old Palasia campus, taught in English and Hindi, and also offers it online. You can book a free demo class first to see how classes are run. For aptitude and coding practice between classes, try more coding questions on Debugshala's practice platform.
From the team behind this site
Go further with the Data Science & AI Course at Debugshala
These tutorials are written by Debugshala, a training and placement institute at Old Palasia, Indore. The classroom course adds live mentoring, real projects and interview preparation.
- Offline classes at Old Palasia, Indore
- Free demo class before you pay
- Non-IT, fresher and year-gap friendly
- Placement assistance
700+ students placed · 200+ hiring partners · 4.9★ Google rating
