

Pandas DataFrame Tutorial: loc, iloc, Filters and groupby
Build pandas DataFrames from dicts, select with loc and iloc, filter, add columns, sort, use groupby and fix missing values, with runnable code.
Think of the results sheet a college office in Indore keeps in Excel. Each row is a student. Each column is something about them: name, city, branch, marks. The clerk filters it to find students from Indore, sorts it by marks, adds a "grade" column, and averages marks per branch for the principal's report.
That clerk is doing pandas work by hand. pandas lets you do the same steps in a few lines of Python, on 10 rows or 10 lakh rows, and repeat them exactly next semester.
What is a pandas DataFrame?
Mapping the sheet onto pandas:
- The whole sheet is a DataFrame.
- The row numbers on the left are the index.
- The headers at the top are the columns.
- One column on its own, say "marks", is a Series.
A pandas DataFrame is a two-dimensional table of data with labelled rows and columns, where each column can hold its own data type.
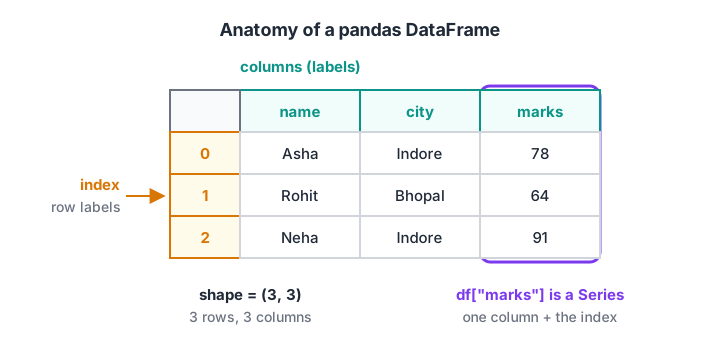
A DataFrame is a set of Series that share one index. Picking a single column gives you back a Series.
Under the hood, each column is a NumPy array. If arrays are new to you, the NumPy arrays tutorial explains dtypes and boolean masks, which pandas reuses everywhere.
Creating a Series and a DataFrame
Series vs DataFrame
A Series is one labelled column. You can build one from a list and give it your own index.
import pandas as pd

marks = pd.Series([78, 64, 91], index=["Asha", "Rohit", "Neha"], name="marks")
print(marks)
print()
print("Neha's marks:", marks["Neha"])
print("Average:", marks.mean())
print("Above 70:\n", marks[marks > 70])
A DataFrame is several Series side by side. The most common way to build one by hand is from a dictionary, where each key becomes a column name.
Building a DataFrame from a dictionary
import pandas as pd

data = {
    "name": ["Asha", "Rohit", "Neha", "Imran", "Priya", "Karan"],
    "city": ["Indore", "Bhopal", "Indore", "Ujjain", "Indore", "Bhopal"],
    "branch": ["CSE", "ECE", "CSE", "ME", "ECE", "CSE"],
    "marks": [78, 64, 91, 58, 83, 70],
}
df = pd.DataFrame(data)

print(df)
print("\nshape:", df.shape)
print("\ncolumn types:\n", df.dtypes)
In real work you would load data with pd.read_csv("file.csv") or from a database, and get the same kind of DataFrame. The first three things to run on any new DataFrame are df.head(), df.shape and df.info(). They tell you what the data looks like, how big it is and which columns have missing values.
Selecting and filtering data
Selecting with loc and iloc
This is where most beginners get confused, so let's be precise.
df["marks"]picks one column (a Series).df[["name", "marks"]]picks several (a DataFrame).df.loc[rows, cols]selects by label: index labels and column names. Slices include the end label.df.iloc[rows, cols]selects by position: 0, 1, 2, like a list. Slices exclude the end position.
import pandas as pd

df = pd.DataFrame({
    "name": ["Asha", "Rohit", "Neha", "Imran", "Priya", "Karan"],
    "city": ["Indore", "Bhopal", "Indore", "Ujjain", "Indore", "Bhopal"],
    "marks": [78, 64, 91, 58, 83, 70],
}, index=[101, 102, 103, 104, 105, 106])   # roll numbers as the index

print(df.loc[103, "name"])          # label 103
print(df.iloc[2, 0])                # third row, first column
print(df.loc[102:104, ["name", "marks"]])   # 102 to 104 inclusive
print(df.iloc[0:2])                 # positions 0 and 1 only
With roll numbers as the index, loc[103] and iloc[2] reach the same student by different routes. When the index is the default 0, 1, 2, the two look identical, which is exactly why people mix them up. Pick loc when you think in names and iloc when you think in positions.
Filtering rows with conditions
Filtering uses a boolean mask, just like NumPy. Put a condition inside df[...] or df.loc[...].
import pandas as pd

df = pd.DataFrame({
    "name": ["Asha", "Rohit", "Neha", "Imran", "Priya", "Karan"],
    "city": ["Indore", "Bhopal", "Indore", "Ujjain", "Indore", "Bhopal"],
    "branch": ["CSE", "ECE", "CSE", "ME", "ECE", "CSE"],
    "marks": [78, 64, 91, 58, 83, 70],
})

print(df[df["marks"] >= 75])
print()
print(df[(df["city"] == "Indore") & (df["branch"] == "CSE")])
print()
print(df[df["city"].isin(["Bhopal", "Ujjain"])][["name", "city"]])
print()
print(df.loc[df["marks"] < 65, "name"].tolist())
The same rules as NumPy apply: use & and |, and wrap each condition in brackets.
Quick check
The DataFrame index is 101, 102, 103, 104. What does df.loc[101:103] return?
loc slices by label and includes the end label, so 103 is part of the result.
Adding columns and sorting
New columns can come from arithmetic on existing ones, from a function, or from a condition.
import numpy as np
import pandas as pd

df = pd.DataFrame({
    "name": ["Asha", "Rohit", "Neha", "Imran", "Priya", "Karan"],
    "branch": ["CSE", "ECE", "CSE", "ME", "ECE", "CSE"],
    "marks": [78, 64, 91, 58, 83, 70],
})

df["percent"] = (df["marks"] / 120 * 100).round(1)   # the exam was out of 120
df["passed"] = df["marks"] >= 60
df["grade"] = np.where(df["marks"] >= 80, "A", np.where(df["marks"] >= 65, "B", "C"))
df = df.assign(bonus_marks=df["marks"] + 5)

print(df.sort_values("marks", ascending=False))
print()
print(df.sort_values(["branch", "marks"], ascending=[True, False])[["branch", "name", "marks"]])
sort_values returns a new, sorted DataFrame and leaves the original alone. If you want to keep the result, assign it back to a variable.
groupby basics: summaries by category
The principal wants average marks per branch. groupby splits the rows into groups, applies a calculation to each group, and combines the results into a new table.
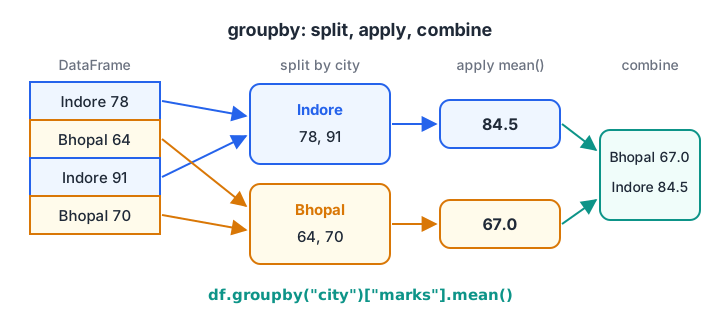
groupby splits rows by a key, applies a function such as mean() to each group, then combines the answers.
import pandas as pd

df = pd.DataFrame({
    "city": ["Indore", "Bhopal", "Indore", "Ujjain", "Indore", "Bhopal"],
    "branch": ["CSE", "ECE", "CSE", "ME", "ECE", "CSE"],
    "marks": [78, 64, 91, 58, 83, 70],
})

print(df.groupby("branch")["marks"].mean())
print()
print(df.groupby("city")["marks"].agg(["count", "mean", "max"]))
print()
print(df.groupby(["city", "branch"])["marks"].mean().reset_index())
agg lets you compute several summaries at once, and reset_index() turns the group labels back into normal columns, which is handy before exporting or charting.
Handling missing values
Real data has gaps: a student skipped an exam, a form field was left empty. pandas marks these as NaN (not a number). Most calculations skip NaN by default, which can quietly hide problems.
import numpy as np
import pandas as pd

df = pd.DataFrame({
    "name": ["Asha", "Rohit", "Neha", "Imran", "Priya"],
    "city": ["Indore", None, "Indore", "Ujjain", "Indore"],
    "marks": [78, np.nan, 91, 58, np.nan],
})

print("Missing per column:\n", df.isna().sum())
print("\nMean ignoring NaN:", df["marks"].mean())

filled = df.fillna({"marks": df["marks"].median(), "city": "Unknown"})
print("\nFilled:\n", filled)

print("\nRows with no gaps:\n", df.dropna())
Which fix is right depends on the meaning. A missing mark because the student was absent might deserve 0, not the median. Decide per column and write the reason down, as in the cleaning stage of the data science lifecycle.
Quick check
Which expression counts missing values in each column?
isna() marks each missing cell as True, and sum() adds up the Trues per column.
Common mistakes with DataFrames
- Mixing up loc and iloc. Remember:
locis labels and includes the end;ilocis positions and excludes it. - Using
andinstead of&. Conditions on columns need&,|and brackets. - Forgetting to assign results.
df.sort_values("marks")alone changes nothing; writedf = df.sort_values("marks"). - Chained assignment.
df[df["marks"] > 80]["grade"] = "A"may not changedf. Usedf.loc[df["marks"] > 80, "grade"] = "A". - Filling every gap with the mean. Think about why the value is missing first.
If you would like to work through pandas on larger, messier datasets in a classroom, Debugshala's Data Science & AI programme runs offline in Indore and online.
Key takeaways
- A DataFrame is a table of Series that share one index.
- Build small DataFrames from dictionaries; load real ones with
read_csv. locselects by label (end included),ilocby position (end excluded).- Filter with boolean masks, add columns with arithmetic or
np.where, and sort withsort_values. groupbyanswers "per category" questions;isna,fillnaanddropnahandle gaps.
FAQ
What is the difference between a Series and a DataFrame in pandas?
A Series is a single labelled column of values with an index. A DataFrame is a collection of Series that share the same index, forming a table. Selecting one column from a DataFrame with df["col"] gives you a Series.
When should I use loc vs iloc?
Use loc when you know the row labels or column names, for example roll numbers or dates. Use iloc when you need rows by position, such as "the first 10 rows" or "every second row". When filtering with a condition and picking columns together, loc is the right choice.
Is pandas enough to get a data science job?
pandas is essential, but it is one part of the toolkit. You also need SQL, statistics, a plotting library and some machine learning, plus projects that show you can use them together. The data scientist roadmap lays out the order.
Can I learn pandas with a teacher in Indore?
Yes. Debugshala, a training and placement institute at Old Palasia in Indore, runs its Data Science & AI course offline at the campus and online, in English and Hindi. Freshers and non-IT graduates can join, and there is a free demo class before you pay. Between classes, you can attempt coding quizzes on Debugshala Test.
From the team behind this site
Go further with the Data Science & AI Course at Debugshala
These tutorials are written by Debugshala, a training and placement institute at Old Palasia, Indore. The classroom course adds live mentoring, real projects and interview preparation.
- Offline classes at Old Palasia, Indore
- Free demo class before you pay
- Non-IT, fresher and year-gap friendly
- Placement assistance
700+ students placed · 200+ hiring partners · 4.9★ Google rating
