

Applications of Data Science in Real Life: Indian Examples
Real applications of data science in India: UPI fraud checks, recommendations, mandi price forecasts and more, with Python code you can run.
Think about a normal Saturday in Indore. You pay for poha at a stall near Sarafa with UPI, order a phone cover online in the afternoon, and book a cab to Vijay Nagar in the evening. You never spoke to an analyst, yet at least five predictions were made about you before dinner.
The UPI app decided in a fraction of a second that your Rs 40 payment was safe. The shopping app chose which twelve covers to show you out of thousands. The cab app estimated that a driver would reach you in six minutes, and picked which driver.
None of this is magic. Each company stored millions of earlier payments, orders and rides and taught a computer to spot patterns in them.
What are the applications of data science?
Map the Saturday back to the concept. The stored payments, orders and rides are the data. The pattern the computer learned, such as "payments from a brand-new phone at 3 am are riskier", is the model. The approve-or-block choice and the six-minute estimate are the predictions, and what the company does with them is the action.
An application of data science is any real decision that is improved by learning patterns from past data and using them to predict or explain what happens next.
The key word is decision. If nobody changes what they do because of the analysis, it is a report, not an application. If you are new to the field itself, read what data science is first, then come back.
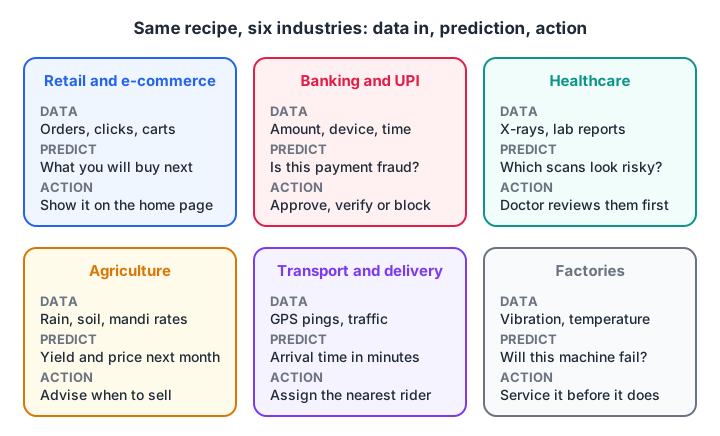
The same three-step recipe (data, prediction, action) repeats in retail, banking, healthcare, agriculture, transport and factories.
The industries change but the recipe does not, so skills from one problem transfer to the others.
Quick check
What turns a data analysis into a data science application?
An application improves a decision. Without an action, the analysis is only a report.
Data science in banking and UPI payments
India processes billions of UPI payments every month, so even a tiny fraud rate means a huge number of bad transactions. Banks and payment apps cannot have a person check each one, so they score every payment automatically.
The model looks at features such as how this amount compares with your usual spend, whether the phone is new, the time of day and whether you have paid this person before. It combines them into a risk score between 0 and 1.
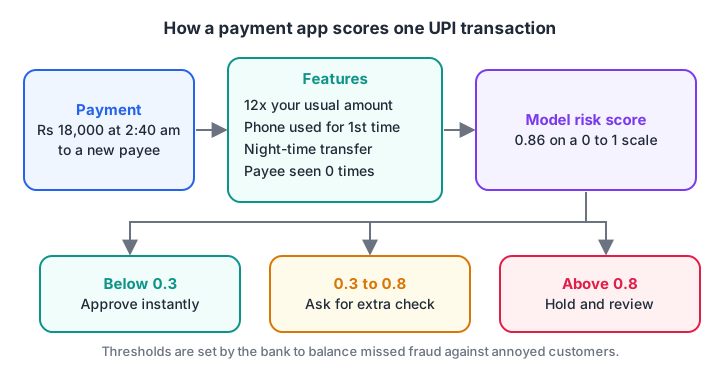
One payment becomes a handful of features, the model turns them into a score, and the score picks one of three actions.
Here is a small version you can run. It flags payments that are far above a customer's normal spending using a z-score, which measures how many standard deviations a value sits from the average.
import numpy as np

# One customer's last 12 UPI payments in rupees
history = np.array([120, 80, 450, 60, 300, 150, 90, 200, 75, 500, 130, 110])
mean, std = history.mean(), history.std()
print(f"Usual spend: Rs {mean:.0f} +/- {std:.0f}")

new_payments = [140, 600, 18000]
for amount in new_payments:
    z = (amount - mean) / std
    if z > 6:
        action = "HOLD and review"
    elif z > 2:
        action = "ask for extra check"
    else:
        action = "approve"
    print(f"Rs {amount:>6}: z = {z:6.1f} -> {action}")
Real systems use dozens of features and trained models, but the idea is the same: learn what normal looks like, then react to what is not normal. That family of methods is covered in anomaly detection.
Banks also use data science for credit scoring. When you apply for a small loan on an app, a model estimates the chance you will repay on time, using your repayment history and income records.
Data science in retail and e-commerce
Online stores earn more when you find what you want quickly, so recommendations are one of the oldest commercial uses of data science. The simplest version is "people who bought this also bought that".
The code below counts which items appear together in the same order, which is the core idea behind many recommendation features.
import pandas as pd
from itertools import combinations
from collections import Counter

orders = [
    ["phone cover", "screen guard", "charger"],
    ["phone cover", "screen guard"],
    ["earphones", "charger"],
    ["phone cover", "earphones", "screen guard"],
    ["charger", "power bank"],
]
pairs = Counter()
for basket in orders:
    for a, b in combinations(sorted(basket), 2):
        pairs[(a, b)] += 1

top = pd.DataFrame(
    [(a, b, n) for (a, b), n in pairs.most_common(4)],
    columns=["item_a", "item_b", "orders_together"],
)
print(top.to_string(index=False))
Screen guards and phone covers show up together three times, so a store would show a screen guard to anyone viewing a cover. Larger systems learn from ratings and browsing too; see recommender systems for how they scale.
Demand forecasting is the other big retail use. A kirana store or a large chain wants to know how many packets of each item to stock before Diwali, so it does not run out or overstock.
Data science in agriculture and food supply
Madhya Pradesh grows a large share of India's soybean, and farmers around Indore and Ujjain sell their crop in mandis where prices move daily. A forecast of next month's price helps a farmer decide whether to sell now or store the harvest.
Forecasting starts with something simple, like a moving average of recent prices, and only moves to complex models when the simple one is beaten. Here is that baseline on made-up mandi prices:
import pandas as pd

# Weekly modal soybean price in Rs per quintal (illustrative numbers)
prices = pd.Series(
    [4420, 4460, 4390, 4510, 4580, 4550, 4620, 4700],
    index=pd.date_range("2026-09-06", periods=8, freq="W"),
)
ma3 = prices.rolling(3).mean()
forecast = ma3.iloc[-1]
change = prices.iloc[-1] - prices.iloc[-4]

for day, price in prices.tail(4).items():
    print(day.date(), price)
print(f"3-week moving average forecast: Rs {forecast:.0f}")
print(f"Change over 3 weeks: Rs {change:+.0f}")
Weather data, satellite images of fields and soil test results feed more advanced crop yield models. The techniques for data indexed by time are covered in time series analysis.
Healthcare, transport and manufacturing
Healthcare
Models trained on thousands of labelled chest X-rays or eye scans can flag images that look abnormal, so a radiologist reviews the riskiest ones first. The doctor still makes the diagnosis; the model only reorders the queue.
Hospitals also forecast bed and oxygen demand from admission trends, which matters during seasonal outbreaks of dengue or flu.
Transport and delivery
Food delivery and cab apps predict arrival time from distance, live traffic, the restaurant's preparation speed and even the weather. They also match each order to a rider so that total waiting time across the city stays low.
Railways and airlines use similar models to forecast delays and demand.
Manufacturing
Factories in industrial belts such as Pithampur run machines that are expensive to stop. Sensors record vibration and temperature every second, and a model learns the pattern that comes before a breakdown, so engineers can service the machine during a planned shutdown instead of during a rush order.
How to pick an application to learn from
The table below summarises the examples by problem type. Problem type matters more than industry, because it decides which technique you learn.
| Application | Problem type | Typical data | Starting technique |
|---|---|---|---|
| UPI fraud check | Anomaly detection, classification | Amount, device, time, payee | z-score, then logistic regression |
| Product recommendations | Ranking | Orders, ratings, clicks | Co-occurrence counts |
| Mandi price forecast | Time series forecasting | Daily or weekly prices | Moving average |
| Loan approval | Classification | Repayment history, income | Logistic regression |
| Delivery time estimate | Regression | Distance, traffic, prep time | Linear regression |
| Machine failure warning | Classification, anomaly detection | Sensor readings | Threshold rules, then tree models |
To choose your first one:
- Pick a decision you understand personally, such as when to sell a crop or which payments look odd.
- Find a public dataset or create a small realistic one.
- Build the simplest baseline from the table.
- Write down what action the result would change.
This is also the start of the data science lifecycle. Who does each part of that work in a company is explained in data scientist vs data analyst vs ML engineer.
If you want to work through applications like these with a mentor and a batch of classmates, data science and AI training in Indore at Debugshala covers them from Python basics to models, in English and Hindi. For quick revision between projects, solve data science MCQs on Debugshala Test.
Common mistakes when thinking about applications
- Assuming every application needs deep learning. Many production systems run on rules, averages and logistic regression because they are fast and easy to explain.
- Ignoring the action. A fraud score is useless until someone decides the thresholds for approve, verify and block.
- Forgetting the cost of errors. Blocking a genuine payment annoys a customer; missing a fraud loses money. Both costs shape the model.
- Treating predictions as facts. A forecast is a best guess with uncertainty, and good teams report that uncertainty.
Quick check
Quick check
A cab app estimating your driver's arrival in minutes is which problem type?
The output is a number (minutes), so it is a regression problem.
Key takeaways
- Data science applies wherever past data can improve a future decision.
- Every application follows data, pattern, prediction and action.
- Indian examples include UPI fraud scoring, recommendations, mandi price forecasts, medical image triage, delivery estimates and predictive maintenance.
- Problem type (classification, regression, ranking, forecasting) decides the technique more than the industry does.
- Start with a simple baseline before reaching for complex models.
FAQ
What are the most common applications of data science in India?
The most common are fraud detection in UPI and banking, product recommendations in e-commerce, delivery and ride time estimates, credit scoring for loans, crop and price forecasting in agriculture, and medical image screening. Each one turns past records into a prediction that changes a business or personal decision.
Which industry uses data science the most?
Banking, fintech and e-commerce are among the heaviest users because they produce large volumes of digital transactions every day. Healthcare, agriculture, logistics and manufacturing are growing users as more of their records and sensors go digital. The underlying skills are the same across all of them.
Is data science used in agriculture in Madhya Pradesh?
Yes, in areas such as crop yield estimation from weather and satellite data, soil health analysis and mandi price forecasting. Soybean and wheat farmers in the Malwa region benefit when forecasts help them decide when to sell. Many of these projects use public government data.
Can I build a data science application as a beginner?
Yes. Start with a small decision, such as flagging unusual expenses in your own UPI history or forecasting a weekly price with a moving average. The code examples on this page run in your browser and are a good template to modify.
Where can I learn data science applications with projects in Indore?
Debugshala teaches its Data Science & AI course at the Old Palasia campus in Indore and also online, in English and Hindi. It accepts fresh graduates and non-IT students, offers placement assistance, and lets you attend a free demo class before paying. Call +91-8982385539 to book one.
From the team behind this site
Go further with the Data Science & AI Course at Debugshala
These tutorials are written by Debugshala, a training and placement institute at Old Palasia, Indore. The classroom course adds live mentoring, real projects and interview preparation.
- Offline classes at Old Palasia, Indore
- Free demo class before you pay
- Non-IT, fresher and year-gap friendly
- Placement assistance
700+ students placed · 200+ hiring partners · 4.9★ Google rating
