

Matplotlib Tutorial: Data Visualization in Python for Beginners
Learn data visualization with matplotlib: Figure and Axes, line, bar, histogram and scatter plots, subplots, labels and saving charts, with examples.
Remember drawing graphs in school on graph paper? You took a sheet, drew a box with two axes, marked numbers along each side, plotted points in pencil, joined them, and wrote a heading on top. If the teacher wanted two graphs, you drew two boxes on the same sheet.
Matplotlib works exactly like that sheet of graph paper. Once you see which part of your code is the sheet, which is the box and which is the pencil line, every matplotlib example on the internet becomes easy to read.
What is matplotlib?
Mapping the graph paper to code:
- The whole sheet of paper is the Figure.
- Each box with its own axes is an Axes (a single plot area; one Figure can hold many).
- The pencil lines, bars and dots are artists drawn on the Axes.
- The heading, the axis labels and the numbers along the sides are the title, labels and ticks.
Matplotlib is an open-source Python library for creating static, animated and interactive charts, where you draw artists such as lines and bars onto Axes that sit inside a Figure.
It is the base layer of Python plotting. pandas' .plot() method and the seaborn library both draw with matplotlib underneath, so learning it pays off everywhere.
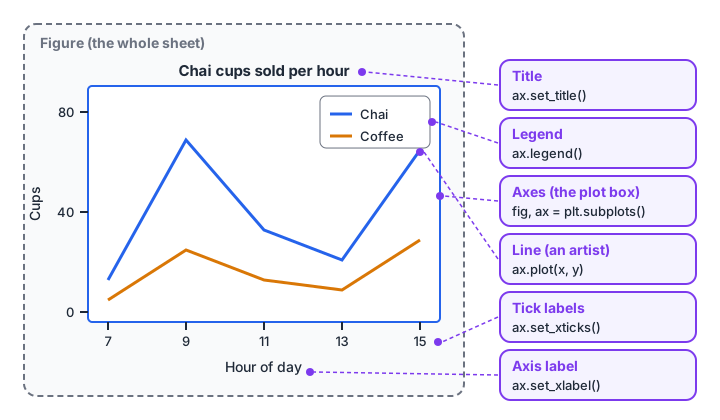
Every element you see on a chart has a method on the Axes object that controls it.
Quick check
In matplotlib, what does plt.subplots() return?
fig, ax = plt.subplots() gives you the Figure (the whole sheet) and the Axes (the plot area) to draw on.
How to install and import matplotlib
Install it once with pip, inside your project's environment:
pip install matplotlibThen import the pyplot module under its standard short name:
import matplotlib.pyplot as pltThe code blocks that draw charts on this page are marked as display-only, because chart windows cannot open in the browser runner here. Copy them into Jupyter, VS Code or a .py file on your computer. The data-preparation blocks are runnable, so you can check the numbers before you plot them.
Your first line chart with matplotlib
Suppose a chai stall records cups sold each hour. A line chart shows how sales change through the day.
import matplotlib.pyplot as plt

hours = [7, 8, 9, 10, 11, 12, 13, 14, 15, 16]
chai = [14, 40, 68, 52, 33, 30, 22, 25, 46, 64]
coffee = [5, 12, 25, 20, 13, 12, 9, 10, 18, 29]

fig, ax = plt.subplots(figsize=(8, 4))
ax.plot(hours, chai, marker="o", label="Chai")
ax.plot(hours, coffee, marker="s", label="Coffee")
ax.set_title("Cups sold per hour")
ax.set_xlabel("Hour of day")
ax.set_ylabel("Cups")
ax.legend()
ax.grid(alpha=0.3)
plt.show()
Read it line by line. plt.subplots() gives you a Figure and one Axes. Each ax.plot() adds a line artist. The set_ methods label the chart, and legend() uses the label= you passed to each line.
The two ways to use matplotlib
You will see two styles online. The pyplot style calls plt.plot(), plt.title() and so on, and matplotlib guesses which Axes you mean. The object-oriented style calls methods on ax directly, as above.
| pyplot style | Object-oriented style | |
|---|---|---|
| Example | plt.plot(x, y) |
ax.plot(x, y) |
| Title | plt.title("...") |
ax.set_title("...") |
| Good for | Quick one-off checks | Anything with more than one plot |
| Risk | Drawing on the wrong plot by accident | Slightly more typing |
Prefer the object-oriented style. It is what the official matplotlib documentation recommends for anything non-trivial, and it never confuses which plot you are editing.
Which matplotlib chart should you use?
Charts answer questions. Pick the question first and the chart follows.
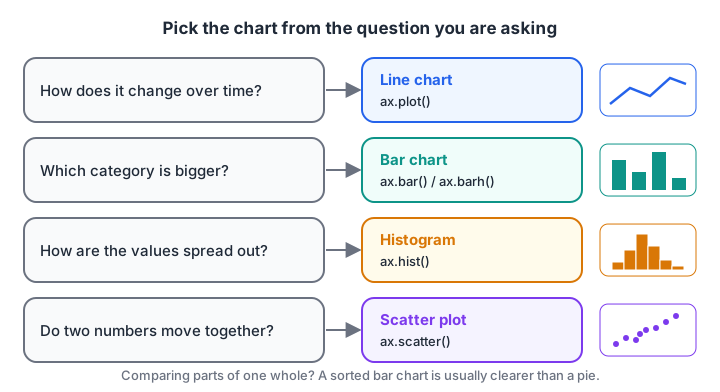
Four questions cover most beginner analysis. Each maps to one Axes method.
Bar chart: compare categories
A bar chart compares amounts across categories, such as orders by area. Sort the bars so the reader sees the ranking at once.
import matplotlib.pyplot as plt

areas = ["Vijay Nagar", "Palasia", "Rau", "Bhawarkua", "Sudama Nagar"]
orders = [420, 380, 150, 310, 220]
pairs = sorted(zip(orders, areas))           # ascending, so largest ends on top
values, labels = zip(*pairs)

fig, ax = plt.subplots(figsize=(7, 4))
bars = ax.barh(labels, values, color="#2563eb")
ax.bar_label(bars, padding=3)                # write the value at each bar's end
ax.set_title("Orders by area, October")
ax.set_xlabel("Orders")
fig.tight_layout()
plt.show()
Horizontal bars (barh) keep long category names readable. bar_label() writes the number at the end of each bar, so readers do not have to estimate.
Histogram: see how values are spread
A histogram groups numbers into ranges called bins and counts how many fall in each. It answers "what is typical, and how spread out is it?" Before plotting, it helps to see what a histogram actually computes. NumPy does the same counting that ax.hist() does:
import numpy as np

rng = np.random.default_rng(3)
delivery_minutes = rng.normal(32, 7, 500).clip(10, 60)

counts, edges = np.histogram(delivery_minutes, bins=range(10, 65, 5))
for c, lo, hi in zip(counts, edges[:-1], edges[1:]):
    print(f"{lo:>2.0f}-{hi:<2.0f} min | {'#' * (c // 6):<24} {c}")
print(f"Median: {np.median(delivery_minutes):.1f} min")
That text chart is a histogram turned sideways. The matplotlib version draws the same counts as bars:
import numpy as np
import matplotlib.pyplot as plt

rng = np.random.default_rng(3)
delivery_minutes = rng.normal(32, 7, 500).clip(10, 60)

fig, ax = plt.subplots()
ax.hist(delivery_minutes, bins=range(10, 65, 5), edgecolor="white")
ax.axvline(np.median(delivery_minutes), color="#e11d48", linestyle="--", label="Median")
ax.set_xlabel("Delivery time (minutes)")
ax.set_ylabel("Number of orders")
ax.legend()
plt.show()
The number of bins changes the story. Too few bins hide detail; too many make noise. Try a few values and pick the one that shows the shape honestly.
Scatter plot: do two numbers move together?
A scatter plot places one dot per row, with one number on each axis. It is the first check before any linear regression.
import numpy as np
import matplotlib.pyplot as plt

rng = np.random.default_rng(5)
temp = rng.uniform(24, 42, 60)
bottles = 12 * temp - 180 + rng.normal(0, 25, 60)

fig, ax = plt.subplots()
ax.scatter(temp, bottles, alpha=0.7, c=temp, cmap="viridis")
ax.annotate("Hottest day", xy=(temp.max(), bottles[temp.argmax()]),
            xytext=(30, 300), arrowprops={"arrowstyle": "->"})
ax.set_xlabel("Temperature (C)")
ax.set_ylabel("Cold drinks sold")
plt.show()
annotate() adds a labelled arrow to a point, which is the easiest way to guide your reader to the one thing that matters on a chart.
Quick check
You want to show how delivery times are spread across 500 orders. Which method fits?
A histogram counts how many values fall in each range, which shows the spread.
Subplots, styling and saving charts
Several charts in one figure
Reports often need charts side by side. plt.subplots(rows, cols) returns an array of Axes:
import matplotlib.pyplot as plt

months = ["Jul", "Aug", "Sep", "Oct"]
revenue = [2.1, 2.4, 2.2, 3.0]   # lakh rupees
orders = [410, 450, 430, 560]

fig, (ax1, ax2) = plt.subplots(1, 2, figsize=(10, 4), layout="constrained")
ax1.plot(months, revenue, marker="o", color="#0d9488")
ax1.set_title("Revenue (lakh Rs)")
ax2.bar(months, orders, color="#d97706")
ax2.set_title("Orders")
fig.suptitle("Shop performance, July to October")
fig.savefig("shop_summary.png", dpi=150, bbox_inches="tight")
layout="constrained" stops titles and labels from overlapping. For uneven grids, look up plt.subplot_mosaic() in the documentation; it lets you describe a layout like "AAB;CCB".
Saving a chart
fig.savefig() writes the figure to a file. Use PNG at dpi=150 or more for reports and slides, or SVG and PDF when the chart must stay sharp at any size. bbox_inches="tight" trims extra white space. Call savefig before plt.show(), because in scripts the figure may be closed once the window shuts.
Plotting straight from pandas
A pandas DataFrame has a .plot() method that calls matplotlib for you, and it returns an Axes you can keep customising. If you have not met DataFrames yet, read the pandas DataFrame tutorial first.
import pandas as pd

df = pd.DataFrame({"month": ["Jul", "Aug", "Sep", "Oct"], "orders": [410, 450, 430, 560]})
ax = df.plot(x="month", y="orders", kind="bar", legend=False, color="#7c3aed")
ax.set_ylabel("Orders")
ax.figure.savefig("orders.png", dpi=150, bbox_inches="tight")
Building charts like these for real reports is part of a guided data science course with mentors in Indore, where your charts get reviewed for clarity, not just correctness. To check that your Python basics are solid enough for plotting code, take a short Python quiz on Debugshala Test.
Common matplotlib mistakes
- Mixing
plt.andax.calls. With several subplots,plt.title()labels whichever Axes was active last. Useax.set_title(). - No axis labels or units. A chart without "minutes" or "Rs" on the axis forces readers to guess.
- Pie charts with many slices. People compare lengths better than angles. A sorted bar chart is almost always clearer.
- Truncated bar axes. Bars should start at zero, or small differences look huge.
- Forgetting
plt.show()in a script. Notebooks display charts automatically; plain.pyscripts do not.
Key takeaways
- A Figure holds one or more Axes; you draw artists like lines and bars on an Axes.
- Use
fig, ax = plt.subplots()and the object-orientedax.methods. - Line for time, bar for categories, histogram for spread, scatter for relationships.
- Label axes with units, start bars at zero and use
annotate()to point at what matters. - Save with
savefig(dpi=150, bbox_inches="tight")beforeplt.show().
FAQ
What is matplotlib used for in data science?
Matplotlib is used to draw charts that explore data and explain results: line charts for trends, bar charts for comparisons, histograms for distributions and scatter plots for relationships. It is also the drawing engine behind pandas plotting and seaborn, so most Python charts depend on it.
What is the difference between matplotlib and seaborn?
Matplotlib is the low-level library that gives full control over every element of a chart. Seaborn is built on top of it and creates statistical charts from DataFrames in fewer lines, with grouping and colours handled for you. Many people use seaborn for quick charts and matplotlib to fine-tune them.
Is matplotlib hard to learn?
No. You can make useful charts in a day if you learn the Figure and Axes idea first and stick to ax. methods. Most confusion comes from mixing the pyplot and object-oriented styles, which this tutorial avoids.
How do I save a matplotlib chart as an image?
Call fig.savefig("chart.png", dpi=150, bbox_inches="tight") after drawing and before plt.show(). Change the extension to .svg or .pdf for sharp vector output. Higher dpi values give larger, crisper images for print.
Can I learn data visualization with Python in Indore?
Yes. Debugshala teaches matplotlib, seaborn and dashboard-style reporting as part of its Data Science & AI course at Old Palasia, Indore, and online. Classes run in English and Hindi, and you can attend a free demo class first. Call +91-8982385539 or email info@debugshala.com.
From the team behind this site
Go further with the Data Science & AI Course at Debugshala
These tutorials are written by Debugshala, a training and placement institute at Old Palasia, Indore. The classroom course adds live mentoring, real projects and interview preparation.
- Offline classes at Old Palasia, Indore
- Free demo class before you pay
- Non-IT, fresher and year-gap friendly
- Placement assistance
700+ students placed · 200+ hiring partners · 4.9★ Google rating
