

A/B Testing for Data Scientists: Design, Sample Size, Analysis
Plan and analyse A/B tests: sample size, random assignment, two-proportion z-test, confidence intervals, peeking and sample ratio mismatch, in Python.
Say you run the website for a sweet shop in Indore that ships namkeen and mithai across India. The current product page has a grey "Add to cart" button. Your designer swears that a bright orange "Order now" button will sell more.
You could change the button and compare this week's sales with last week's. But this week has Diwali traffic, last week had a payment outage, and a food blogger mentioned you on Tuesday. You would never know whether the button made the difference.
The fix is to run both buttons at the same time. Half of today's visitors, picked at random, see grey; the other half see orange. Everything else that happens this week hits both groups equally. That is an A/B test.
What is A/B testing?
Map the shop to the vocabulary:
- The grey button is the control, version A.
- The orange button is the treatment or variant, version B.
- "Share of visitors who place an order" is the primary metric, here a conversion rate.
- Assigning each visitor to A or B by a coin flip is randomisation.
A/B testing is a controlled experiment in which users are randomly assigned to two or more versions of a product, and a statistical test decides whether a difference in a chosen metric is larger than chance would produce.
Randomisation is the whole trick. Because a coin decides who sees what, the two groups are alike on average in every way: device, city, mood, festival shopping. Any difference in orders that is too large for chance can be credited to the button. That is why A/B tests can show causation, while a plain correlation in historical data cannot.
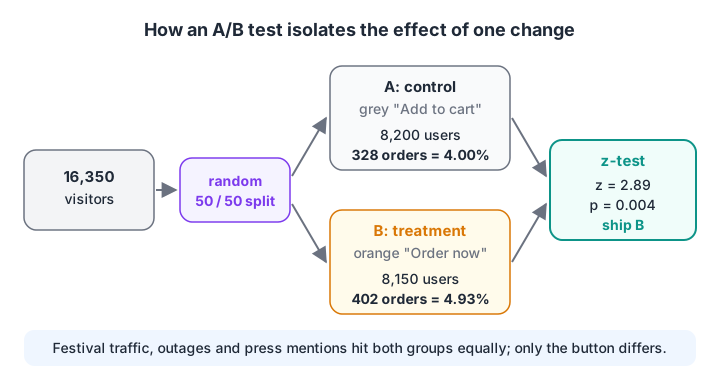
Randomisation makes the two groups comparable, so the test isolates the effect of the one change.
How to design an A/B test, step by step
- Write a hypothesis. "The orange 'Order now' button will raise the order rate on product pages."
- Pick one primary metric. Order conversion rate. Add guardrail metrics you must not harm, such as refund rate or page load time.
- Set the minimum detectable effect (MDE). The smallest lift worth acting on. Here, going from 4% to 5%.
- Calculate the sample size for your α (usually 0.05) and power (usually 80%).
- Randomise at the right unit. Usually the user, not the page view, so one person always sees the same version.
- Run for the planned duration, covering at least one full week so weekday and weekend behaviour both appear.
- Analyse once, at the end, with the test you chose in advance.
Steps 3 and 4 are where most teams cut corners. Without them, you do not know whether a "no difference" result means the button is useless or the test was too small to notice.
How many users does an A/B test need?
The sample size depends on four things: the baseline rate, the lift you want to detect, the significance level α and the power (the chance of detecting the lift if it is real). The hypothesis testing tutorial explains α and power as the two error types.
The standard formula for comparing two proportions uses normal quantiles, which Python's statistics.NormalDist provides.
from statistics import NormalDist
from math import sqrt, ceil

def sample_size_per_group(p1, p2, alpha=0.05, power=0.80):
    z = NormalDist()
    z_alpha = z.inv_cdf(1 - alpha / 2)
    z_beta = z.inv_cdf(power)
    p_bar = (p1 + p2) / 2
    num = (z_alpha * sqrt(2 * p_bar * (1 - p_bar)) + z_beta * sqrt(p1*(1-p1) + p2*(1-p2))) ** 2
    return ceil(num / (p2 - p1) ** 2)

for target in [0.06, 0.05, 0.045, 0.042]:
    n = sample_size_per_group(0.04, target)
    print(f"Detect 4.0% -> {target:.1%}: {n:>7,} users per group")
Detecting a jump from 4% to 5% needs about 6,700 users in each group. Detecting 4% to 4.2% needs over 150,000. Small effects are expensive, which is the √n rule from the central limit theorem showing up again.
Assigning users consistently
In production, you do not flip a fresh coin on every page load. You hash the user ID together with the experiment name, so the same user always lands in the same group and different experiments split users independently.
import hashlib

def assign(user_id, experiment="orange_button_v1", split=50):
    key = f"{experiment}:{user_id}".encode()
    bucket = int(hashlib.md5(key).hexdigest(), 16) % 100
    return "B" if bucket < split else "A"

users = [f"user{i}" for i in range(10_000)]
groups = [assign(u) for u in users]
print("user42 ->", assign("user42"), "| again ->", assign("user42"))
print("Share in B:", groups.count("B") / len(groups))
Analysing the results with a two-proportion z-test
The test ran for two weeks. Group A had 8,200 visitors and 328 orders (4.00%). Group B had 8,150 visitors and 402 orders (4.93%). Is that gap real?
Because a conversion rate is the mean of a 0/1 column, its sampling distribution is approximately normal. The two-proportion z-test divides the difference in rates by its standard error, computed from the pooled rate under the null hypothesis of no difference.
from statistics import NormalDist
from math import sqrt

n_a, orders_a = 8200, 328
n_b, orders_b = 8150, 402

p_a, p_b = orders_a / n_a, orders_b / n_b
p_pool = (orders_a + orders_b) / (n_a + n_b)
se_pool = sqrt(p_pool * (1 - p_pool) * (1 / n_a + 1 / n_b))
z = (p_b - p_a) / se_pool
p_value = 2 * (1 - NormalDist().cdf(abs(z)))

se_diff = sqrt(p_a * (1 - p_a) / n_a + p_b * (1 - p_b) / n_b)
low, high = (p_b - p_a) - 1.96 * se_diff, (p_b - p_a) + 1.96 * se_diff

print(f"A: {p_a:.2%}   B: {p_b:.2%}   relative lift: {(p_b - p_a) / p_a:.1%}")
print(f"z = {z:.2f}, p-value = {p_value:.4f}")
print(f"95% CI for the difference: {low:.2%} to {high:.2%} (percentage points)")
The p-value is about 0.004, below 0.05. The confidence interval runs from roughly 0.3 to 1.6 percentage points, so even the cautious end is a gain. You would ship the orange button. Report the interval alongside the lift; "23% lift" alone hides how uncertain that number is.
Common A/B testing pitfalls
Peeking and stopping early
Checking the dashboard every day and stopping as soon as p < 0.05 feels efficient. It is the most common way to fool yourself. Each look is another chance for random noise to cross the line.
The simulation below runs 1,000 A/A tests, where both groups have the identical 5% rate, so every "significant" result is a false positive. It compares analysing once at the end with checking 20 times along the way.
import numpy as np

rng = np.random.default_rng(1)
sims, n, looks = 1000, 4000, 20
a = rng.random((sims, n)) < 0.05          # both groups truly 5%
b = rng.random((sims, n)) < 0.05

checkpoints = np.linspace(n / looks, n, looks).astype(int)
ca, cb = a.cumsum(axis=1)[:, checkpoints - 1], b.cumsum(axis=1)[:, checkpoints - 1]
pa, pb = ca / checkpoints, cb / checkpoints
pool = (ca + cb) / (2 * checkpoints)
se = np.sqrt(pool * (1 - pool) * 2 / checkpoints)
z = np.abs(pb - pa) / np.where(se == 0, 1, se)

print(f"False positive rate, one look at the end: {np.mean(z[:, -1] > 1.96):.1%}")
print(f"False positive rate, stop at any of {looks} looks: {np.mean((z > 1.96).any(axis=1)):.1%}")
One look keeps false positives near the promised 5%. Twenty looks push them past 20%. If you must monitor early, use a method designed for it, such as sequential testing, or the Bayesian approach from the Bayes' theorem tutorial.
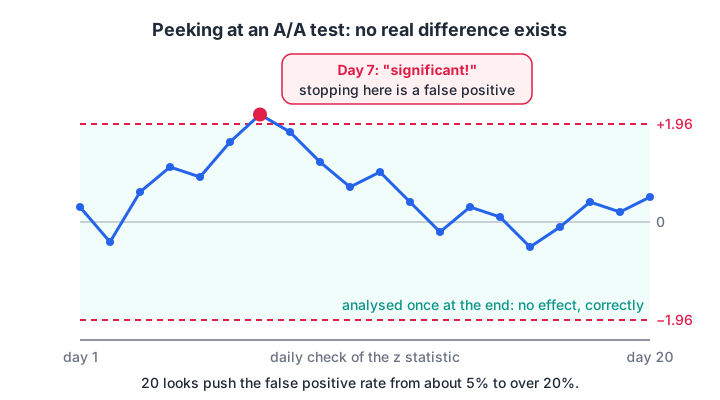
In an A/A test the z statistic wanders randomly; checking often makes it likely to cross ±1.96 at some point.
Sample ratio mismatch
If you planned a 50/50 split but got 8,200 vs 7,700 users, something is broken: a redirect drops some B users, or bots hit one version. This is a sample ratio mismatch (SRM), and it makes the results untrustworthy. A chi-square test on the counts flags it.
from math import erfc, sqrt

def srm_check(n_a, n_b, expected_share_a=0.5):
    total = n_a + n_b
    exp_a, exp_b = total * expected_share_a, total * (1 - expected_share_a)
    chi2 = (n_a - exp_a) ** 2 / exp_a + (n_b - exp_b) ** 2 / exp_b
    return chi2, erfc(sqrt(chi2 / 2))         # chi-square p-value, 1 degree of freedom

for a, b in [(8200, 8150), (8200, 7700)]:
    chi2, p = srm_check(a, b)
    print(f"A={a}, B={b}: chi2={chi2:.2f}, p={p:.5f}", "-> SRM, investigate!" if p < 0.001 else "-> OK")
Other traps
- Too many metrics. Track 20 metrics and one will move by chance. Name one primary metric up front.
- Novelty effect. Regular users click a new design because it is new. Run long enough for the spike to fade.
- Wrong unit. Randomising page views while measuring users double-counts heavy visitors.
- Interference. In marketplaces or referral schemes, treated users can affect control users, which blurs the comparison.
- Biased traffic. If only mobile users enter the test, the result may not hold on desktop. The sampling techniques tutorial covers how to keep samples representative.
Quick check
Your A/B test reaches p = 0.03 on day 3 of a planned 14-day run. What should you do?
Stopping as soon as p dips below 0.05 inflates false positives. Stick to the planned sample size unless you use a sequential method designed for early stopping.
Quick check
You planned a 50/50 split but got 52,000 users in A and 48,000 in B. What is the first concern?
A split this far from 50/50 with this many users is extremely unlikely by chance. Investigate assignment and tracking before trusting any metric.
Key takeaways
- An A/B test randomly splits users so that the only systematic difference between groups is the change you made.
- Fix the hypothesis, primary metric, MDE, sample size and duration before launch.
- Small lifts need very large samples; use the sample size formula rather than guessing.
- Analyse conversion rates with a two-proportion z-test and always report a confidence interval.
- Do not peek and stop early, check for sample ratio mismatch, and watch for novelty effects.
To run experiments like these on real product data with feedback from a trainer, look at the Debugshala Data Science & AI course. For quick self-checks, practise MCQs on Debugshala Test.
FAQ
What is A/B testing in data science?
A/B testing is a randomised controlled experiment used to compare two versions of a product, page or feature.
Users are randomly split into a control group and a treatment group, and a statistical test checks whether a chosen metric, such as conversion rate, differs by more than chance. It is the standard way to measure the causal effect of a change.
How long should an A/B test run?
Run it until you reach the sample size you calculated in advance, and for at least one full week so every day of the week is covered. Two weeks is common. Stopping early because results look good inflates false positives, and very short tests can be fooled by novelty effects or a single unusual day.
What is a good sample size for an A/B test?
It depends on your baseline rate and the smallest lift you care about. Going from a 4% to a 5% conversion rate needs about 6,700 users per group at α = 0.05 and 80% power. Smaller lifts need far more. Always compute it with a sample size formula before launching.
What is the difference between A/B testing and hypothesis testing?
Hypothesis testing is the general statistical method of checking data against a null hypothesis. A/B testing is a specific application: a designed experiment with random assignment, where a hypothesis test, often a two-proportion z-test or t-test, is used to analyse the result. A/B testing adds the experiment design around the test.
Can I learn A/B testing and experimentation in Indore?
Yes. Debugshala, an industry-aligned training and placement institute at Old Palasia, Indore, teaches statistics and experiment analysis within its Data Science & AI course. You can attend offline at the campus or online, in English or Hindi, and start with a free demo class. Non-IT graduates are welcome to join.
From the team behind this site
Go further with the Data Science & AI Course at Debugshala
These tutorials are written by Debugshala, a training and placement institute at Old Palasia, Indore. The classroom course adds live mentoring, real projects and interview preparation.
- Offline classes at Old Palasia, Indore
- Free demo class before you pay
- Non-IT, fresher and year-gap friendly
- Placement assistance
700+ students placed · 200+ hiring partners · 4.9★ Google rating
