

Sampling Techniques in Statistics: Types with Python Examples
Simple random, systematic, stratified, cluster and convenience sampling compared, with sampling bias, sample size formulas and pandas code to try.
Suppose a training institute wants to know whether college students in Indore prefer evening or weekend batches. There are roughly 40,000 students in the 50 colleges it works with. Asking all of them would take months.
The quick idea is to stand outside one engineering college at 4 pm and ask whoever walks by. You would get answers by dinner time. You would also get almost no commerce or arts students, no one who leaves early for a part-time job, and only people from one campus.
The question is not whether to sample. It is how to choose the sample so that 400 answers tell the truth about 40,000 people. That is what sampling techniques are for.
What is sampling in statistics?
Map the survey to the terms:
- All 40,000 students are the population.
- The actual list you can pick names from, such as the colleges' enrolment registers, is the sampling frame.
- The 400 students you survey are the sample.
- The true share who prefer evening batches is a parameter; your sample's share is a statistic that estimates it.
Sampling is the process of selecting a subset of a population, using a defined method, so that statistics computed on the subset give reliable estimates of the population's parameters.
Two kinds of error matter. Sampling error is the natural wobble from looking at only part of the population, and the central limit theorem tells you how large it is.
Bias is a systematic tilt from a bad method, and more data does not remove it. The same applies to experiments: an A/B test run on unrepresentative traffic gives a clean answer for the wrong audience.
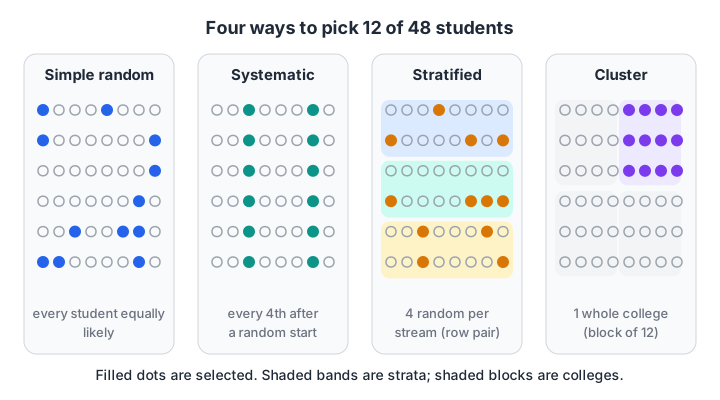
Each method picks the same number of units, but in a different pattern; the pattern decides which kinds of error you are exposed to.
Probability sampling methods
In probability sampling, every member of the population has a known, non-zero chance of being picked. That is what lets you attach a margin of error to your estimate.
The code blocks below build the same synthetic population each time: 40,000 students in three streams, where engineering students lean towards evening batches and arts students towards weekends. Because we built it, we know the true answer and can see how close each method gets.
Simple random sampling
Every student has the same chance, and every possible group of 400 is equally likely. It is the baseline every other method is compared with.
import numpy as np
import pandas as pd

rng = np.random.default_rng(10)
N = 40_000
stream = rng.choice(["Engineering", "Commerce", "Arts"], size=N, p=[0.5, 0.3, 0.2])
pref_rate = pd.Series(stream).map({"Engineering": 0.70, "Commerce": 0.50, "Arts": 0.30})
students = pd.DataFrame({"stream": stream, "prefers_evening": rng.random(N) < pref_rate})
print(f"True share preferring evening: {students.prefers_evening.mean():.3f}")

for seed in range(3):
    s = students.sample(n=400, random_state=seed)
    print(f"Simple random sample {seed + 1}: {s.prefers_evening.mean():.3f}")
Each sample lands within a few points of the truth. They differ from one another because of sampling error, which is expected and measurable.
Systematic sampling
Pick a random starting point in the list, then take every k-th member, where k = N / n. With 40,000 students and a sample of 400, k is 100. It is easy to do by hand from a register.
The danger is a hidden pattern in the list. If every 100th name happens to be a class topper, your sample is skewed. Check the ordering first.
Stratified sampling
Split the population into strata, groups that differ on something that matters, then sample randomly within each one. With proportional allocation, each stratum gets the same share of the sample as it has in the population: 50% engineering, 30% commerce, 20% arts.
Stratifying guarantees every group is represented and usually gives a more precise estimate than simple random sampling of the same size.
import numpy as np
import pandas as pd

rng = np.random.default_rng(10)
N = 40_000
stream = rng.choice(["Engineering", "Commerce", "Arts"], size=N, p=[0.5, 0.3, 0.2])
pref_rate = pd.Series(stream).map({"Engineering": 0.70, "Commerce": 0.50, "Arts": 0.30})
students = pd.DataFrame({"stream": stream, "prefers_evening": rng.random(N) < pref_rate})

k = 100
start = int(rng.integers(0, k))
systematic = students.iloc[start::k]

stratified = students.groupby("stream").sample(frac=0.01, random_state=1)

print(f"Truth:      {students.prefers_evening.mean():.3f}")
print(f"Systematic: {systematic.prefers_evening.mean():.3f}  (n={len(systematic)})")
print(f"Stratified: {stratified.prefers_evening.mean():.3f}  (n={len(stratified)})")
print(stratified.stream.value_counts(normalize=True).round(2).to_dict())
groupby("stream").sample(frac=0.01) takes 1% from each stream, so the sample mirrors the population's stream mix exactly.
Cluster and multistage sampling
Sometimes you cannot reach individuals directly, but you can reach groups. In cluster sampling, you randomly pick whole clusters, such as 8 of the 50 colleges, and survey everyone in them. Travel and permissions shrink from 50 campuses to 8.
The cost is precision. Students in the same college are similar to each other, so 8 colleges carry less information than the same number of students spread across all 50. Multistage sampling is the middle path: pick colleges at random, then pick students at random inside each chosen college.
| Method | How it picks | Best when | Main risk |
|---|---|---|---|
| Simple random | Every unit equally likely | You have a complete list | Can miss small groups by chance |
| Systematic | Every k-th unit after a random start | Lists or queues, manual sampling | Hidden periodic pattern in the list |
| Stratified | Random within each subgroup | Groups differ and all must appear | Needs subgroup labels in advance |
| Cluster | Random whole groups | Population is spread out, travel is costly | Less precise, clusters may be unusual |
| Multistage | Random groups, then random units | Large national or city surveys | More complex error calculation |
Quick check
You randomly pick 6 of 60 bank branches and survey every customer in those 6. Which method is this?
Selecting whole groups at random and surveying everyone inside them is cluster sampling.
Quick check
A survey of 10,000 people collected only from an app's most active users gives a very narrow confidence interval. What is the main problem?
A narrow interval only reflects sampling error. Selection bias from surveying only active users is not reduced by a larger sample.
Non-probability sampling methods
Non-probability sampling chooses people by convenience or judgement rather than chance. It is cheap and fast, and it is fine for early exploration or user interviews. It is not fine when you need a trustworthy number for the whole population.
- Convenience sampling: whoever is easiest to reach, such as the 4 pm crowd at one gate.
- Quota sampling: fill fixed counts per group (say 200 engineering, 120 commerce, 80 arts), but pick people within each group by convenience.
- Purposive (judgement) sampling: an expert hand-picks "typical" cases.
- Snowball sampling: each respondent refers others. Useful for hard-to-reach groups, such as freelancers in a niche skill.
Here is what convenience sampling does to the estimate. Suppose the gate you stand at is mostly engineering students.
import numpy as np
import pandas as pd

rng = np.random.default_rng(10)
N = 40_000
stream = rng.choice(["Engineering", "Commerce", "Arts"], size=N, p=[0.5, 0.3, 0.2])
pref_rate = pd.Series(stream).map({"Engineering": 0.70, "Commerce": 0.50, "Arts": 0.30})
students = pd.DataFrame({"stream": stream, "prefers_evening": rng.random(N) < pref_rate})

# Engineering students are 6x as likely to walk past your gate
reach = students.stream.map({"Engineering": 6, "Commerce": 1, "Arts": 1})
convenience = students.sample(n=400, weights=reach, random_state=3)
big_convenience = students.sample(n=4000, weights=reach, random_state=3)

print(f"Truth:                    {students.prefers_evening.mean():.3f}")
print(f"Convenience, n=400:       {convenience.prefers_evening.mean():.3f}")
print(f"Convenience, n=4,000:     {big_convenience.prefers_evening.mean():.3f}")
print(convenience.stream.value_counts(normalize=True).round(2).to_dict())
The convenience sample overstates evening preference by about 10 points. Collecting ten times as many responses at the same gate does not help; the estimate just becomes a more confident wrong answer. That is bias.
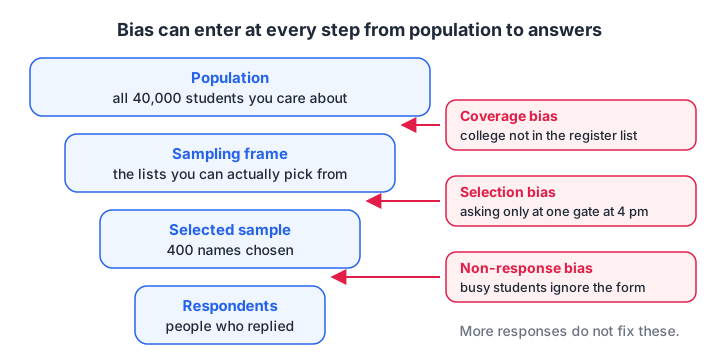
Bias can enter at every stage between the population you care about and the answers you actually receive.
How big should a sample be?
For estimating a proportion, a common starting formula is n = z² × p(1 − p) / e², where z is 1.96 for 95% confidence, e is the margin of error you can accept, and p is your best guess of the proportion. Using p = 0.5 gives the largest, safest n.
When the sample is a noticeable share of a small population, the finite population correction reduces it: n_adj = n / (1 + (n − 1) / N).
from math import ceil
from statistics import NormalDist

def sample_size(margin, confidence=0.95, p=0.5, population=None):
    z = NormalDist().inv_cdf(1 - (1 - confidence) / 2)
    n = z**2 * p * (1 - p) / margin**2
    if population:
        n = n / (1 + (n - 1) / population)
    return ceil(n)

for e in [0.10, 0.05, 0.03]:
    print(f"Margin ±{e:.0%}: n = {sample_size(e):>5} (large population), "
          f"{sample_size(e, population=40_000):>5} (N=40,000), "
          f"{sample_size(e, population=500):>4} (N=500)")
About 385 responses give a ±5% margin, whether the city has 40,000 students or 4 million. Population size barely matters until the population itself is small.
Sampling in machine learning projects
The same ideas apply when you split data for a model. A random train/test split is simple random sampling. If one class is rare, say 5% fraud, a plain random split can leave the test set with too few fraud cases. Passing stratify=y makes it a stratified split.
import numpy as np
from sklearn.model_selection import train_test_split

rng = np.random.default_rng(0)
X = rng.normal(size=(1000, 3))
y = (rng.random(1000) < 0.05).astype(int)        # 5% positive class

_, _, _, y_test_plain = train_test_split(X, y, test_size=0.2, random_state=7)
_, _, _, y_test_strat = train_test_split(X, y, test_size=0.2, random_state=7, stratify=y)

print(f"Positive rate overall:        {y.mean():.3f}")
print(f"Test set, plain random split: {y_test_plain.mean():.3f}")
print(f"Test set, stratified split:   {y_test_strat.mean():.3f}")
Stratified splits matter most for imbalanced data and for cross-validation, where each fold should look like the whole dataset.
Common sampling mistakes
- Confusing a big sample with a good one. A large biased sample is still biased.
- Sampling from the wrong frame. Surveying app users tells you nothing about people who never installed the app.
- Ignoring non-response. If only enthusiastic students reply, the result tilts towards enthusiasm. Track response rates by group.
- Survivorship bias. Studying only the startups that survived hides what made the others fail.
- Forgetting to stratify rare groups. A simple random sample of 400 may contain very few students from a small stream.
Key takeaways
- A sample is only as good as the method that chose it; probability sampling lets you measure the error.
- Simple random is the baseline; stratified improves precision and guarantees every group appears; cluster saves cost at some loss of precision.
- Non-probability methods are fine for exploration, not for population estimates.
- Bias does not shrink with more data; sampling error does.
- About 385 responses give a ±5% margin at 95% confidence for most populations.
- Use
stratify=ywhen splitting imbalanced data for machine learning.
You now have the probability and inference toolkit for this series. The next topic, linear algebra for data science, covers the maths behind how models handle many columns at once.
If you would like these methods taught with real survey and business data, Debugshala's Indore data science programme for graduates includes them, and you can warm up with aptitude and statistics quizzes on Debugshala Test.
FAQ
What are the main types of sampling techniques?
Sampling techniques fall into two families. Probability sampling includes simple random, systematic, stratified, cluster and multistage sampling, where each member has a known chance of selection. Non-probability sampling includes convenience, quota, purposive and snowball sampling, where selection depends on access or judgement. Probability methods are needed for reliable population estimates.
What is the difference between stratified and cluster sampling?
In stratified sampling you divide the population into groups and sample some members from every group, which improves precision. In cluster sampling you randomly choose a few whole groups and survey everyone inside them, which saves cost. Stratified uses all groups partly; cluster uses some groups fully.
What is the best sampling method?
There is no single best method. Simple random sampling is the cleanest when you have a complete list. Stratified sampling is usually better when subgroups differ and must all be represented. Cluster sampling wins when reaching scattered individuals is expensive. Choose based on your frame, budget and which subgroups matter.
Why is sampling important in data science?
Data scientists rarely see the full population. Training data, survey results and A/B test users are all samples. If the sample is biased, every model and report built on it inherits that bias, so sampling tells you whether a dataset can answer your question at all.
Can I learn sampling and statistics in a data science course in Indore?
Yes. Debugshala, an industry-aligned training and placement institute at Old Palasia, Indore, covers sampling, probability and inference in its Data Science & AI course. Classes are offered offline and online, in English and Hindi. There is a free demo class before you pay, and fresh graduates, non-IT students and people with a year gap can apply.
From the team behind this site
Go further with the Data Science & AI Course at Debugshala
These tutorials are written by Debugshala, a training and placement institute at Old Palasia, Indore. The classroom course adds live mentoring, real projects and interview preparation.
- Offline classes at Old Palasia, Indore
- Free demo class before you pay
- Non-IT, fresher and year-gap friendly
- Placement assistance
700+ students placed · 200+ hiring partners · 4.9★ Google rating
