

K-Means Clustering Explained: Algorithm, Elbow and Silhouette
K-means clustering explained with dark-store planning: the assign and update loop, scaling, choosing k with elbow and silhouette, k-means++ and limits.
A quick-commerce startup wants to open three dark stores in Indore so that groceries reach every customer fast. It has the delivery addresses of its first thousand customers, but no idea where the natural pockets of demand are.
A practical planner would start by sticking three pins on the map anywhere. Every customer is then served by the nearest pin. Next, each pin is moved to the middle of the customers it serves.
Some customers are now closer to a different pin, so they switch. Repeat a few times, and the pins settle into the centres of three neighbourhoods of demand.
That pin-shuffling routine is the k-means algorithm.
What is k-means clustering?
Map the dark-store plan to machine learning:
- Each customer address is a data point, with no label attached.
- The three pins are the centroids, and 3 is k, the number of clusters.
- "Served by the nearest pin" is the assignment step.
- "Move the pin to the middle" is the update step.
- Total squared travel distance from customers to their store is the inertia (within-cluster sum of squares).
K-means clustering is an unsupervised learning algorithm that partitions data into k clusters by repeatedly assigning each point to the nearest centroid and recomputing each centroid as the mean of its assigned points, minimising the total within-cluster squared distance.
Unlike everything in the supervised section of this series, which ended with ensemble learning, there is no target column. K-means finds structure on its own. Don't confuse it with k-nearest neighbours: there, k counts neighbours and labels are required. The code here targets scikit-learn 1.7.
How does the k-means algorithm work?
- Choose k and place k starting centroids (randomly, or with the smarter k-means++ method).
- Assign: give every point to its nearest centroid, using Euclidean distance.
- Update: move each centroid to the mean of the points assigned to it.
- Repeat steps 2 and 3 until no point changes cluster, or the centroids move less than a small tolerance.
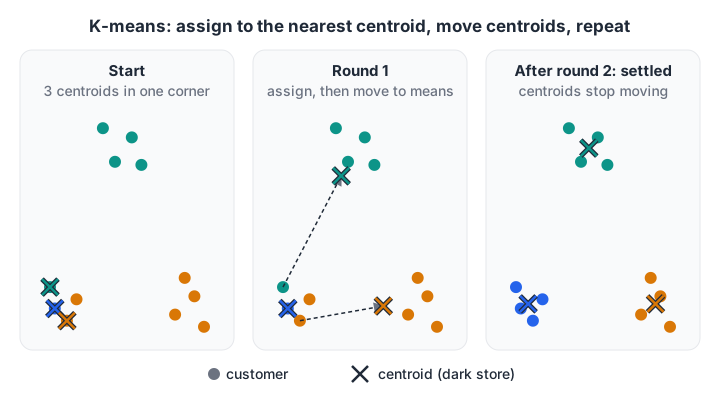
Two rounds of assign-and-update are enough to pull three badly placed centroids into the middle of three groups.
Each step can only lower inertia or leave it unchanged, so the algorithm always stops. Here it is in NumPy, starting from a deliberately bad position with all three hubs in one corner:
import numpy as np

# 12 customer locations (km east, km north) and 3 delivery hubs placed at random
customers = np.array([[1.0, 1.2], [1.5, 0.8], [0.8, 1.9], [1.9, 1.5],
                      [6.0, 1.0], [6.8, 1.6], [7.2, 0.6], [6.4, 2.2],
                      [3.5, 6.0], [4.2, 6.8], [3.0, 7.1], [4.6, 5.9]])
hubs = customers[[0, 1, 2]].copy()           # a deliberately bad start: all hubs in one corner

for step in range(1, 10):
    # 1. assignment: each customer goes to the nearest hub
    dist = np.linalg.norm(customers[:, None, :] - hubs[None, :, :], axis=2)
    nearest = dist.argmin(axis=1)
    # 2. update: move each hub to the mean of its customers
    new_hubs = np.array([customers[nearest == k].mean(axis=0) for k in range(3)])
    inertia = (dist[np.arange(len(customers)), nearest] ** 2).sum()
    print(f"step {step}: inertia {inertia:6.2f}  hubs {new_hubs.round(1).tolist()}")
    if np.allclose(new_hubs, hubs):
        print("hubs stopped moving: converged")
        break
    hubs = new_hubs
print("cluster of each customer:", nearest)
The first round drags two hubs out of the corner, and inertia (measured before each move) falls from about 230 to 22 and then 6. By step 3 the hubs stop moving, with one hub per group of four customers. Real data takes more rounds, but the loop is the same.
Quick check
What are the two steps k-means repeats until it converges?
Assignment and update alternate until no point changes cluster.
K-means clustering in Python with scikit-learn
In practice you use KMeans. Two settings matter from the start:
n_clusters: k.n_init: how many times to restart from different centroids, keeping the best result. Recent scikit-learn versions changed the default, so set it explicitly.
K-means uses distances, so features must be on comparable scales. Here a food-delivery app segments customers by orders per month and average basket in rupees; without scaling, the rupee column would decide everything.
import numpy as np
import pandas as pd
from sklearn.cluster import KMeans
from sklearn.preprocessing import StandardScaler

rng = np.random.default_rng(4)
def group(n, orders, basket):
    return np.column_stack([rng.normal(orders, 1.0, n), rng.normal(basket, 120, n)])
X = np.vstack([group(60, 2, 350), group(40, 9, 450), group(25, 4, 1600)])
df = pd.DataFrame(X, columns=["orders_per_month", "avg_basket_rs"]).clip(lower=0)

scaled = StandardScaler().fit_transform(df)
km = KMeans(n_clusters=3, n_init=10, random_state=0).fit(scaled)
df["segment"] = km.labels_

profile = df.groupby("segment").agg(customers=("orders_per_month", "size"),
                                    orders=("orders_per_month", "mean"),
                                    basket=("avg_basket_rs", "mean")).round(1)
print(profile.sort_values("basket"))
The three segments come out clearly: about 60 occasional customers with small baskets, about 40 frequent customers with mid-sized baskets, and about 25 who order less often but spend about ₹1,600 each time. Profiling clusters with a groupby like this is how you turn cluster numbers into business names, the same idea behind RFM segmentation.
How do you choose k in k-means?
K-means will happily produce any number of clusters you ask for, so choosing k is your job. Two common checks:
- Elbow method: plot inertia against k. Inertia always falls as k grows, but the fall slows sharply once k passes the natural number of groups. That bend is the elbow.
- Silhouette score: for each point, compare its average distance to its own cluster (a) with the average distance to the nearest other cluster (b): s = (b − a) / max(a, b). Values near 1 mean tight, well-separated clusters; near 0 means overlapping ones. Pick the k with the highest average.
from sklearn.cluster import KMeans
from sklearn.datasets import make_blobs
from sklearn.metrics import silhouette_score

X, _ = make_blobs(n_samples=500, centers=4, cluster_std=1.1, random_state=8)

print(" k | inertia | silhouette")
for k in range(2, 9):
    km = KMeans(n_clusters=k, n_init=10, random_state=0).fit(X)
    print(f"{k:2d} | {km.inertia_:7.0f} | {silhouette_score(X, km.labels_):.3f}")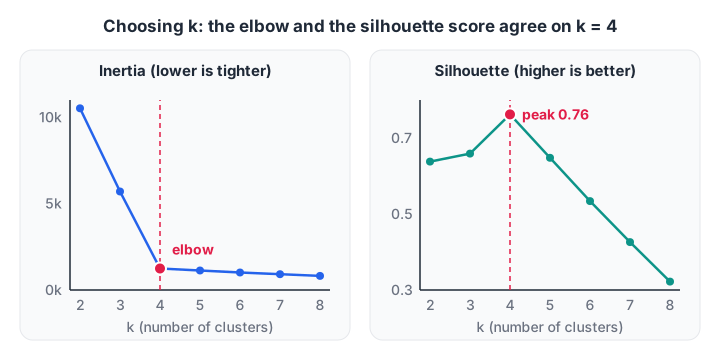
Both checks agree: inertia stops falling fast after k = 4, and the silhouette score is highest at k = 4.
Inertia drops from about 10,500 at k = 2 to about 1,250 at k = 4, then only creeps down. The silhouette score peaks at about 0.76 for k = 4.
On real data the elbow is often blurry and the two checks may disagree; then choose the k whose clusters are easiest to act on. Three segments a marketing team can name beat seven that nobody can use.
Silhouette costs grow with the square of the row count, so on large data compute it on a random sample, or use the faster Calinski-Harabasz index from sklearn.metrics.
Quick check
Inertia keeps falling as k grows from 2 to 10. What does that tell you?
More centroids always mean shorter distances, so raw inertia can't choose k.
What is k-means++ initialisation?
K-means only finds a local minimum. A bad starting position can leave two centroids sharing one group while two real groups are merged under a single centroid, and the loop will never escape.
k-means++ spreads the starting centroids out: the first is a random point, and each next one is chosen with probability proportional to its squared distance from the nearest centroid already picked. It is scikit-learn's default init.
from sklearn.cluster import KMeans
from sklearn.datasets import make_blobs

X, _ = make_blobs(n_samples=600, centers=8, cluster_std=0.9, random_state=3)

for init in ["random", "k-means++"]:
    runs = [KMeans(n_clusters=8, init=init, n_init=1, random_state=s).fit(X).inertia_
            for s in range(20)]
    print(f"{init:9s} 20 single runs: best {min(runs):6.0f} | worst {max(runs):6.0f} | "
          f"runs within 1% of best: {sum(r < 1.01 * min(runs) for r in runs)}")

best = KMeans(n_clusters=8, n_init=10, random_state=0).fit(X)
print(f"n_init=10 keeps the best of 10 starts: inertia {best.inertia_:.0f}")
With purely random starts, 20 single runs range from an inertia of about 880 to about 3,900, and only one of them finds the best solution.
With k-means++ the worst run is about 1,300 and seven runs hit the best. Running several starts with n_init=10 and keeping the lowest inertia finds the best answer here. Use both: k-means++ and more than one start.
Limitations of k-means clustering
K-means assumes each cluster is a round blob around its mean, with roughly similar spread. It struggles when:
| Data situation | What goes wrong | Better option |
|---|---|---|
| Elongated or curved clusters (two moons) | Splits them with straight boundaries | DBSCAN |
| Very different cluster sizes or spreads | Steals points from the big cluster | Gaussian mixture models |
| Many outliers | Means get dragged towards outliers | DBSCAN, or k-medoids |
| Unknown number of groups | Forces exactly k clusters | Hierarchical clustering or DBSCAN |
| Categorical features | Means of categories are meaningless | k-modes, or encode carefully |
For very large datasets, MiniBatchKMeans updates centroids from small random batches and is much faster, with slightly higher inertia. The next tutorial, hierarchical clustering, builds a whole tree of clusters so you don't have to fix k up front.
Common k-means mistakes
- Not scaling features. The largest-unit column decides the clusters.
- Trusting one run. Use k-means++ with
n_initof 10 or more. - Picking k only from the elbow. Check the silhouette score and whether the clusters make business sense.
- Reading clusters as truth. K-means always returns k groups, even in data with no real structure.
- Feeding raw IDs or one-hot columns without thought. Distances on them rarely mean anything useful.
Clustering projects like customer segmentation are a common portfolio piece, and Debugshala's ML course for freshers in Indore works through them with real data. To check your understanding, solve clustering MCQs on Debugshala Test.
Key takeaways
- K-means groups unlabelled data into k clusters by alternating assignment and centroid updates.
- It minimises inertia and always converges, but only to a local minimum; use k-means++ and several starts.
- Scale features first, because k-means relies on Euclidean distance.
- Choose k with the elbow method, the silhouette score and business sense together.
- K-means suits round, similar-sized clusters; use DBSCAN or hierarchical clustering for other shapes.
FAQ
What is k-means clustering used for?
K-means is used for customer segmentation, grouping stores or areas by sales patterns, compressing images by reducing colours, and as a first look at the structure of unlabelled data. It is popular because it is fast, simple to explain and works well when groups are compact and of similar size.
What is the difference between k-means and KNN?
K-means is an unsupervised clustering algorithm that groups unlabelled points around k centroids. KNN is a supervised algorithm that predicts a label from the k nearest labelled points. In k-means, k is the number of clusters; in KNN, it is the number of neighbours consulted for each prediction.
How do I choose the number of clusters in k-means?
Run k-means for a range of k, plot inertia to look for an elbow, and compute the silhouette score for each k. The best k usually sits at the elbow and near the highest silhouette. Then check that the clusters are meaningful and usable for the business question you are answering.
Does k-means always give the same result?
No. K-means starts from randomly chosen centroids, so different runs can end in different local minima. Setting random_state makes a run repeatable, and using k-means++ initialisation with n_init of 10 or more makes the result far more stable, because scikit-learn keeps the run with the lowest inertia.
Can I learn clustering and unsupervised learning at Debugshala?
Yes. K-means, hierarchical clustering and DBSCAN are covered in Debugshala's Machine Learning course at Old Palasia, Indore. Classes are offline in English and Hindi, and the course accepts fresh graduates, non-IT learners and people with a year gap. Visit 204-208 C.S. Naidu Arcade or email info@debugshala.com to book a free demo.
From the team behind this site
Go further with the Data Science & AI Course at Debugshala
These tutorials are written by Debugshala, a training and placement institute at Old Palasia, Indore. The classroom course adds live mentoring, real projects and interview preparation.
- Offline classes at Old Palasia, Indore
- Free demo class before you pay
- Non-IT, fresher and year-gap friendly
- Placement assistance
700+ students placed · 200+ hiring partners · 4.9★ Google rating
